
Quality assurance best practices prevent 85% of production defects when applied at the requirements stage, according to IBM’s Systems Sciences Institute and Capers Jones research. Teams that shift QA left reduce defect costs by 100x compared to teams that catch bugs in production.
QA engineers in Latin America cost $45,000 to $65,000 per year. That is 55 to 65% less than the $125,000 to $200,000 range for a US-based SDET. Nearshore QA teams in Colombia and Mexico work in your timezone with 0 to 3 hours of overlap to US Eastern time.
This guide covers the QA process frameworks that prevent defects at design, the test automation architectures that survive beyond 18 months, and the nearshore hiring strategy that solves the structural QA talent gap.
Why Do Most QA Processes Fail Before a Single Test Runs?
Most QA processes fail because they bolt testing onto the end of the SDLC instead of embedding quality gates at requirements. Reactive QA teams inherit defects they did not cause. Stripe’s Developer Coefficient report found the average developer spends 17.3 hours per week on maintenance and rework, which costs a 50-person team roughly $3.8 million annually.
What Is the Real Cost of Fixing Defects Late?
A defect caught at requirements costs roughly $100 to fix. The same defect in production costs $10,000 or more, according to IBM’s Systems Sciences Institute.
| SDLC Stage | Cost Multiplier | Example Cost per Defect |
|---|---|---|
| Requirements | 1x | ~$100 |
| Design | 1 to 5x | $100 to $500 |
| Coding | 5 to 10x | $500 to $1,000 |
| Testing | 15x | $1,500 |
| Production | 100x | $10,000+ |
Source: IBM Systems Sciences Institute.
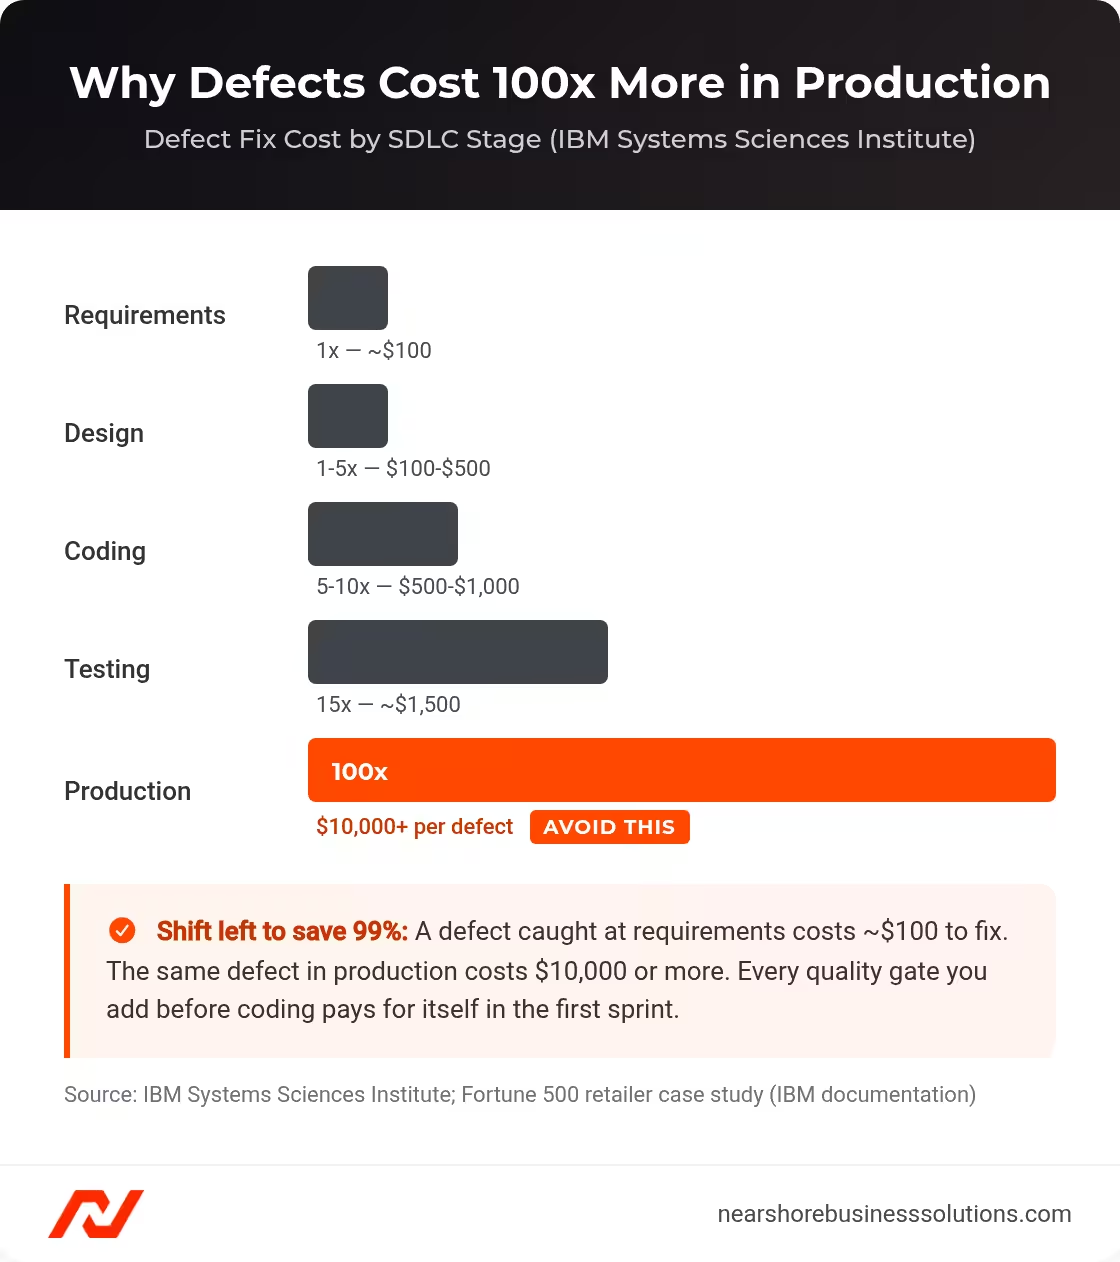
Defect cost curve by SDLC stage: production defects cost 100x more than requirements-stage fixes.
One Fortune 500 retailer moved 60% of defect detection from the UI/E2E tier to the API/integration tier using shift-left API testing, per IBM Systems Sciences Institute documentation. The result was an estimated $1.5 million in annual savings. That trajectory is repeatable. The fix is not more testers at the end. It is moving quality gates to the earliest possible SDLC stage.
How Do Misaligned QA Metrics Create a False Sense of Quality?
Test pass rate and bug count metrics measure activity, not outcomes. Google Cloud’s 2023 Accelerate State of DevOps Report found that high-performing organizations anchor on DORA metrics because they measure system-level results that connect to revenue.
| Vanity Metric (Stop Using) | Why It Misleads | Outcome Metric (Use Instead) |
|---|---|---|
| Test Case Count | Incentivizes volume, not coverage | Automation Coverage % |
| Test Pass Rate | Masks flaky tests and weak assertions | Defect Escape Rate |
| Bugs Found per Sprint | Rewards detection over prevention | Defect Removal Efficiency |
| Manual Test Execution Hours | Measures effort, not effectiveness | Mean Time to Detection |
| Requirements Coverage % | Subjective and inflated | Change Failure Rate |
If your QA dashboard does not include Defect Escape Rate and Change Failure Rate, you are optimizing the wrong inputs.
Where Should QA Sit in Your Org Chart?
QA placement determines its impact. Three models exist, each with distinct trade-offs.
| Model | Best For | Strengths | Trade-offs |
|---|---|---|---|
| Embedded-in-squad | 15 to 50 engineers | Fastest feedback loops, strongest shift-left | Inconsistent standards across squads |
| Centralized CoE | 200+ engineers | Standardized frameworks, unified reporting | Developers disengage from quality ownership |
| Hybrid pods | 50 to 200 engineers | Embedded speed with consistency | Requires deliberate coordination overhead |
When QA has no clear organizational home, quality defaults to no one’s primary responsibility.
What Does a Shift-Left QA Strategy Actually Look Like in Practice?
Shift-left QA moves testing from the back of the SDLC to the front. 62% of engineering organizations cite “detecting defects earlier” as a primary quality goal, according to Capgemini’s World Quality Report. Fewer than half have operationalized it.
How Do You Embed Quality Gates Into Requirements and Design?
Three Amigos sessions prevent defects at the requirements stage. A developer, QA engineer, and product owner collaboratively review requirements before development begins. Four quality gates must pass before any story moves to development:
- Acceptance Criteria Validation. Every criterion follows Given/When/Then format with at least one negative or boundary case. QA engineers hold veto authority.
- Testability Assessment. Edge cases, data dependencies, and integration points are documented. The gate fails if any critical path lacks a feasible automated verification method.
- Test Approach Definition. Test types are assigned and automation feasibility confirmed, enforcing in-sprint automation rather than accumulating debt.
- Non-Functional Requirements. Performance thresholds, security considerations, and observability needs are documented before development starts.
These gates add 20 to 30 minutes per story. That investment pays back the first time it prevents a single defect from reaching the integration tier.
What Static Analysis Checks Actually Scale Across a Large Codebase?
Static analysis catches defect categories that no amount of functional testing efficiently detects. It runs against source code before merging. Elite organizations layer three checks:
- Pre-commit hooks run in under 5 seconds and catch formatting and type errors.
- PR-triggered SAST scans via Jenkins, GitLab CI, or GitHub Actions block merges on critical findings.
- Dependency scanning via Snyk or Dependabot flags known vulnerabilities in third-party packages.
The benchmark for total CI/CD execution is under 15 minutes, with static analysis completing in the first 3 to 5 minutes. Every null reference caught by a linter is a null pointer exception that never becomes a bug ticket.
How Do You Shift Team Incentives From Bug Reports to Bug Prevention?
QA teams measured on bugs found per sprint become optimized for finding bugs, not preventing them. Three changes make prevention operational:
- Replace bug-count targets with Defect Containment Effectiveness metrics.
- Reward testability contributions as visible engineering output: test data factories, flaky test refactoring, and test coverage reviews.
- Use metrics to guide investment decisions, not to rank individuals.
What Test Automation Architecture Survives the Next Three Years?
72% of organizations have implemented some form of test automation, according to Kobiton’s 2023 State of Quality report. Most automation efforts start as scripting tasks and become unmaintainable within 18 months. Durable automation requires the same architectural discipline applied to production code.
How Do You Choose the Right Automation Stack?
Framework selection is a three-year infrastructure bet. The right choice depends on your application architecture, team skills, CI/CD speed requirements, and cross-browser coverage needs.
| Criterion | Playwright | Cypress | Selenium |
|---|---|---|---|
| Best fit | SPA, SSR, hybrid apps | SPA-optimized | Any web architecture |
| Team skills | TypeScript primary; Python and Java bindings available | JavaScript and TypeScript only | Java, Python, C#, JavaScript, Ruby |
| CI/CD speed | Fastest headless execution with built-in parallelization | Fast for small to mid suites | Slowest baseline; requires Grid for parallel runs |
| Adoption trajectory | 35% and growing (State of JS) | Stable at 28% | Declining in new projects at 25% |
A complete stack also includes API testing tools (Postman, REST Assured), performance testing (JMeter, k6), containerized test environments (Docker, Testcontainers), and test management integration (TestRail, Zephyr).
Why Is the Testing Diamond Replacing the Testing Pyramid?
The classic testing pyramid was designed for monoliths. For microservices teams, the testing diamond inverts the proportions. Integration and contract tests become the widest band. Unit tests narrow to algorithmic logic. E2E tests compress to critical user journeys only.
SmartBear’s 2023 API Report confirmed that high-growth companies automate 65% or more of their API tests. Elite coverage ratios follow the diamond: over 80% unit test coverage, over 50% API and integration coverage, and 20 to 30% critical-path E2E coverage.
Contract tests using Pact or Spring Cloud Contract validate service expectations in milliseconds and replace a subset of E2E tests. Integration tests require production-like infrastructure via Testcontainers. E2E tests serve as smoke monitors covering 5 to 10 critical journeys, not broad coverage.
For more on building maintainable test infrastructure, see our guide on nearshore software development services.
How Do You Integrate Tests Into CI/CD Without Slowing Every Deploy?
Eventbrite moved from deploying once every few weeks to over 100 deployments per day, with lead time under 15 minutes. The architecture uses a tiered pipeline with explicit time budgets.
| Tier | Trigger | Time Budget | Test Types |
|---|---|---|---|
| Tier 1: Pre-merge | Every PR | Under 10 min | Unit tests, static analysis, contract tests |
| Tier 2: Post-merge | Every merge to main | Under 20 min | Integration tests against ephemeral environments |
| Tier 3: Full regression | Nightly | Under 45 min | E2E suite, performance baselines, accessibility |
Four practices maintain pipeline speed: AI-driven test impact analysis (Tricentis reports over 70% reduction in execution times), test parallelization and sharding, flaky test quarantine targeting under 2% flaky rate, and observability-driven test prioritization fed by production error data.
What QA Metrics Actually Prove ROI to Engineering Leadership?
Defect Escape Rate and Change Failure Rate are the two metrics that translate QA investment into business outcomes that executives understand.
| Metric | Formula | Elite Benchmark | Business Outcome |
|---|---|---|---|
| Defect Escape Rate | (Production defects / Total defects) x 100 | Under 5% | Fewer support tickets, lower SLA penalties |
| Defect Removal Efficiency | (Pre-release defects removed / Total defects) x 100 | Over 95% | 40 to 50% less post-release maintenance spend |
| Change Failure Rate | (Failed deployments / Total deployments) x 100 | 0 to 15% | Deployment confidence; boards understand this metric |
| Mean Time to Detection | Average time from defect introduction to discovery | Under 1 sprint | Validates automation and observability investments |
Publish Defect Escape Rate and Change Failure Rate in the same executive dashboard that tracks deployment frequency and revenue. Per Google Cloud’s 2023 Accelerate State of DevOps Report, elite organizations maintain Change Failure Rates of 0 to 15%. When leadership sees that metric improve, QA investment stops being a cost center.
How Do You Scale QA Capacity Without Scaling US Headcount Costs?
Scaling QA headcount in the US is a structural problem: the Bureau of Labor Statistics projects 153,900 QA role openings annually through 2032, and LinkedIn showed over 45,000 open SDET positions in Q2 2024 with average time-to-fill of 45 to 60 days. Headcount costs scale 65 to 79% faster in the US than in Latin America. Nearshore QA teams solve this constraint by accessing 150,000 to 240,000 LATAM QA specialists at $45,000 to $65,000 per year.
Why Is US QA Talent So Hard to Hire Right Now?
US salary benchmarks are the primary constraint, per Levels.fyi, Glassdoor, and Robert Half 2024 data. A mid-level SDET earns $125,000 to $160,000. A senior SDET earns $160,000 to $200,000 or more. In San Francisco and New York, those figures run 15 to 25% higher.
| Role | Mid-Level (3 to 6 years) | Senior (6+ years) |
|---|---|---|
| QA Automation Engineer | $110,000 to $140,000 | $140,000 to $170,000 |
| SDET | $125,000 to $160,000 | $160,000 to $200,000+ |
| QA Lead or Manager | $130,000 to $165,000 | $165,000 to $220,000+ |
Sources: Levels.fyi, Glassdoor, Robert Half 2024.
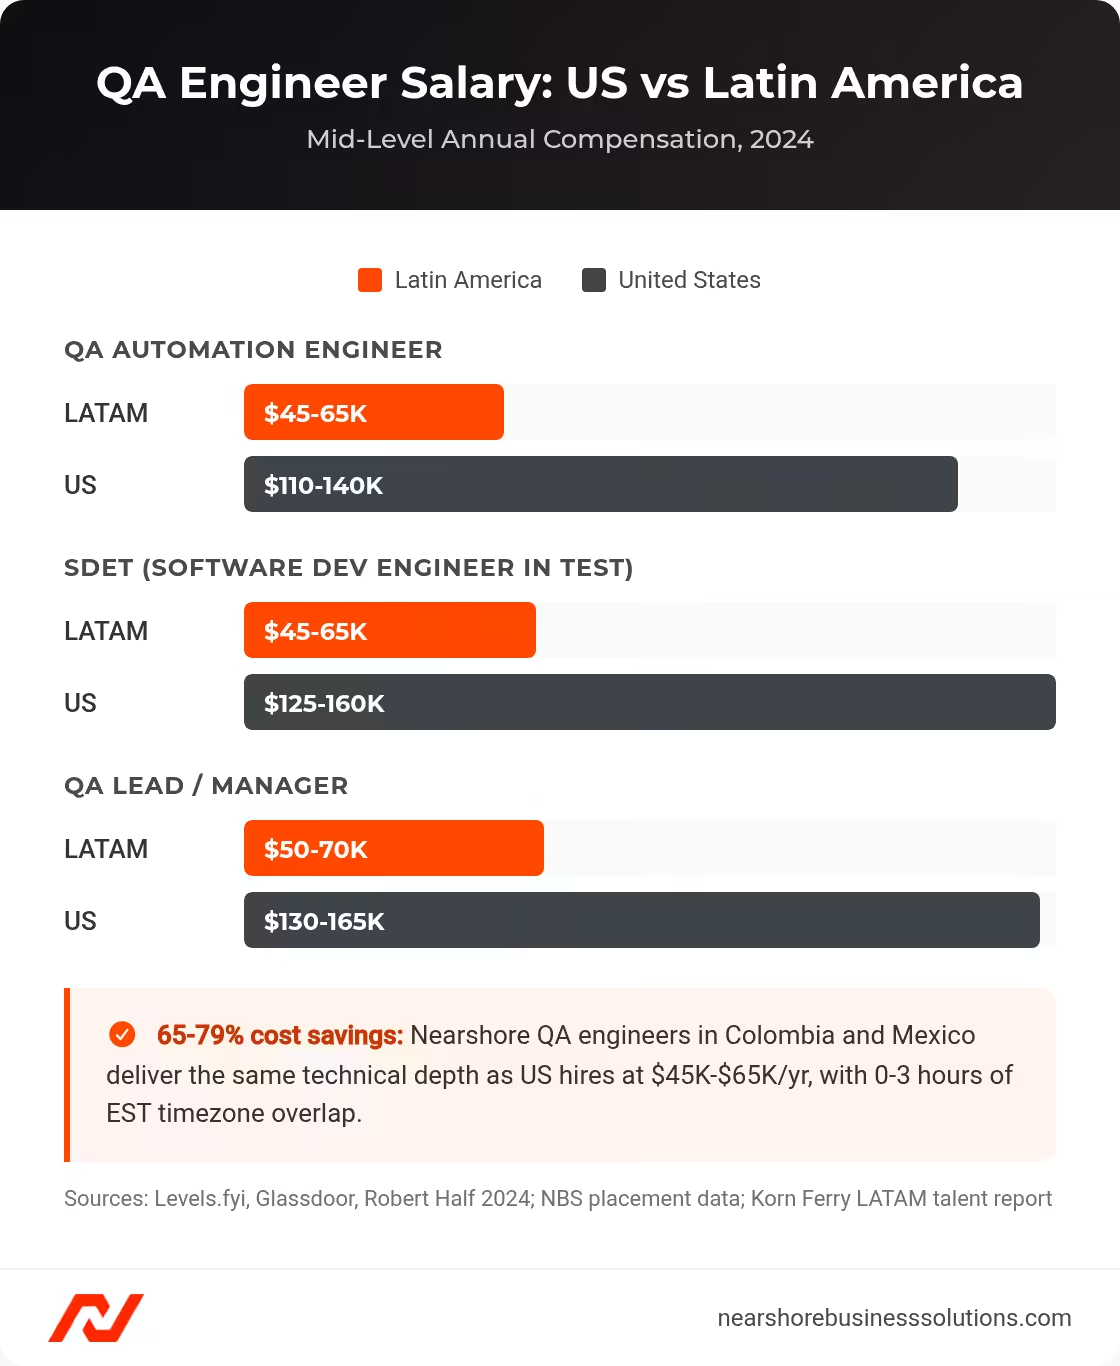
QA engineer salary comparison: Latin America versus US, mid-level annual compensation 2024.
Raising salaries alone does not solve a supply-constrained market with 153,900 annual openings. The structural solution is expanding talent geography.
You can hire QA engineers through NBS with pre-vetted candidates in 3 to 10 business days and a 90-day replacement guarantee.
What Makes Nearshore QA Teams More Effective Than Offshore?
Latin America has an estimated 1.2 million professional software developers, including 150,000 to 240,000 QA and SDET specialists (Nearshore Business Solutions operational data; Korn Ferry LATAM talent market report). The operational advantages over traditional offshore hiring are structural.
| Dimension | Latin America | India | Eastern Europe |
|---|---|---|---|
| Avg. QA Salary (Mid-Level) | $45,000 to $65,000 | $25,000 to $40,000 | $50,000 to $75,000 |
| Time Zone Overlap (EST) | 0 to 3 hours | 9.5 to 10.5 hours | 6 to 7 hours |
| Annual Attrition | 10 to 15% | 20 to 30% | 15 to 20% |
| Cost Savings vs. US Mid SDET | 65 to 79% | Higher savings, higher friction | 47 to 65% |
Colombia offers 0 to 1 hour of EST overlap. Engineers in Bogota and Medellin (home to Ruta N, Colombia’s largest innovation district) show strong Cypress and Playwright proficiency. Approximately 30 to 50% of mid-to-senior QA engineers in LATAM hold ISTQB Foundation Level certification, significantly higher than typical US rates where on-the-job training dominates (ISTQB Global Report 2024).
The time zone advantage enables real-time standup participation, same-day defect triage, and synchronous Three Amigos sessions. That is the single biggest operational differentiator between nearshore and offshore QA.
For a broader view of staff augmentation in Latin America, including engagement models and vetting standards, see our complete guide.
How Do You Integrate Nearshore QA Engineers Into Your Sprints in 90 Days?
Nearshore QA integration follows three phases. Zapier built a dedicated nearshore QA automation team in Colombia and within the first year reduced manual regression testing from 4 days to under 2 hours, decreased critical production bugs by 40%, and moved from bi-weekly releases to multiple daily deployments.
Phase 1: Days 1 to 30 (Foundation). Grant codebase, CI/CD, and test environment access on Day 1. Assign an onboarding buddy. Shadow sprint ceremonies. Execute existing test suites to build domain knowledge.
Phase 2: Days 31 to 60 (Contribution). Own a defined test suite or feature area. Write first automation scripts within sprint cadence. Participate in Three Amigos sessions and defect triage.
Phase 3: Days 61 to 90 (Full Velocity). Operate at full sprint velocity with independent task ownership. Own quality gate sign-off. Deliver first metrics report covering Defect Escape Rate, automation coverage, and flaky test rate. Conduct a 90-day retrospective with engineering leadership.
What Do Engineering Leaders Ask Most About QA Best Practices?
These are the most common questions engineering leaders ask about implementing QA processes and building nearshore QA teams.
What Is the Difference Between QA and QC?
Quality assurance (QA) is process-focused and preventive. It builds quality into the development workflow through standards, reviews, and gates before defects occur. Quality control (QC) is product-focused and detective. It identifies defects in finished work through testing and inspection. Effective QA programs reduce reliance on QC by catching problems earlier.
How Long Does It Take to Build a Shift-Left QA Process?
Most teams see measurable improvement in Defect Escape Rate within one quarter of implementing Three Amigos sessions and pre-merge static analysis. Full transformation takes 6 to 9 months. The critical milestone is sprint 2 to 4: that is when the first defects get caught at requirements rather than in production.
What Automation Coverage Should a Mid-Market Team Target?
Target 80% unit test coverage, 50% API and integration test coverage, and 20 to 30% E2E coverage on critical user journeys. These ratios reflect the testing diamond architecture used by high-growth organizations, per SmartBear’s 2023 API Report. Start with API and integration coverage if your team is currently pyramid-heavy.
How Do You Prevent Test Automation From Becoming Unmaintainable?
Treat test code with the same standards as production code: code reviews, refactoring sprints, and coverage metrics. The two most common failure modes are flaky tests tolerated beyond a 2% threshold and E2E tests that are too broad. Quarantine any test with a flaky rate above 2%. Compress E2E suites to 5 to 10 critical journeys only.
What Is the Typical Cost Savings of a Nearshore QA Hire vs. a US Hire?
A mid-level nearshore QA automation engineer in Colombia or Mexico costs $45,000 to $65,000 per year versus $110,000 to $140,000 for a US equivalent. That is 55 to 65% savings before factoring in recruiting fees, benefits overhead, and time-to-fill costs. NBS’s 90-day placement rate and 90-day replacement guarantee reduce the risk of a bad hire.
How Do You Verify That a Nearshore QA Engineer Fits Your Stack?
NBS screens candidates for the specific frameworks in your stack: Playwright, Cypress, Selenium, k6, or REST Assured. Every candidate completes a live coding assessment under time pressure, not a multiple-choice test. References are verified from US-based companies.
Do Nearshore QA Engineers Participate in Real-Time Meetings?
Yes. Nearshore QA engineers in Colombia, Mexico, and Argentina overlap with US Eastern time by 0 to 3 hours. They participate in daily standups, sprint planning, Three Amigos sessions, and defect triage calls in real time. That is the core operational advantage over offshore teams in India or Eastern Europe.
How Do You Get Started Hiring Nearshore QA Engineers?
Nearshore Business Solutions connects you with vetted QA engineers and SDETs from Latin America. We handle sourcing, technical screening, and placement. You focus on building your product.
Every placement includes a 90-day replacement guarantee. You receive pre-vetted QA candidates in 3 to 10 business days.
Get a free consultation to hire QA engineers and receive a shortlist for your specific stack and team structure.