
Accurate software development cost estimation saves growth-stage companies 30%-50% on budget overruns while protecting 6+ months of runway.
Cost estimation errors cost real money fast. A 50% overrun on a major launch increases monthly burn by $150K-$250K for a company burning $500K/month. LATAM developers cost $45-$90/hour versus $125-$260/hour in San Francisco, giving you a built-in cost lever before estimation even begins.
Below you will find every major estimation methodology, sector-specific benchmarks, salary data by geography, and a step-by-step estimation process. All figures are calibrated for 2026 growth-stage SaaS, FinTech, HealthTech, and EdTech companies.
What Is Software Development Cost Estimation?
Software development cost estimation calculates the total investment to build, deploy, and maintain a software product. Growth-stage companies ($5M-$100M ARR) now use parametric models instead of gut feeling.
VCs prioritize capital efficiency. The Rule of 40 (growth rate plus profit margin exceeds 40%) became the SaaS standard. AI-native firms now face a Rule of 60. Estimation errors directly impact fundraising and valuation.
Why Does Software Development Cost Estimation Matter?
Estimation errors can shorten runway by 6 months. A 50% cost overrun on a major launch increases annual burn by 30%-50%. For a company burning $500K monthly, that adds $150K-$250K to monthly expenses and drops runway from 18 months to 12.
High-performing SaaS companies generate $125K ARR per employee. Companies missing estimates by 30%-40% show $80K-$90K per employee, signaling poor scalability to investors.
What Components Make Up a Software Development Estimate?
Six budget categories cover the full cost of a software project.
- Development (60%-70%): Engineering salaries, contractors, project management. A mid-complexity web app with four engineers for six months costs $200K-$300K.
- QA/Testing (20%): Budget $40K for a $200K project. Skipping QA creates 3x-5x more production defects.
- Maintenance: $40K in year one for bug fixes and patches. Grows to $40K-$60K by year three.
- Cloud Hosting: $12K annually for new products, scaling to $48K with growth. Serverless reduces costs 20%-30% versus VMs.
- Compliance/Security: $15K initial for SOC 2 and penetration testing. $10K-$20K annually for renewals.
- AI Retraining: $10K initial for API integration. $15K-$30K annually as data volumes grow.
What Factors Affect Software Development Costs?
Four main variables drive estimation variance: project size, complexity, team composition, and technology choices. Each factor can shift your final number by 20%-50%.
How Does Team Composition Impact Costs?
A typical growth-stage team of 5-8 developers and 2 QA specialists costs over $1.2M annually in US domestic payroll before benefits (30%-40% overhead), taxes, and infrastructure.
The same team in Latin America costs $400K-$600K fully loaded. Developers in Mexico City, Bogota, Buenos Aires, and Sao Paulo work within 1-4 hours of US time zones, enabling real Agile collaboration without the 10%-15% communication overhead of Asia-based offshore.
| Experience Level | US Hourly | US Annual | LATAM Hourly | LATAM Annual | COCOMO Multiplier |
|---|---|---|---|---|---|
| Senior | $62-$260+/hr | $128K-$180K base | $45-$90/hr | ~$65K fully loaded | 0.71x (high capability) |
| Mid-Level | $95-$185/hr | $80K-$120K | $25-$55/hr | $40K-$70K | 1.00x |
| Junior | $40-$70/hr | $50K-$75K | $20-$35/hr | $30K-$50K | 1.42x (low capability) |
How Does Project Complexity Influence Costs?
FinTech compliance (PCI DSS, KYC/AML, SOC 2) adds 15%-25% to total budget. HealthTech HIPAA compliance adds another 15%-25% through encryption, audit trails, and access controls.
Poor architectural choices create technical debt that blocks scaling. A monolithic architecture handling 10K users may need a complete rewrite at 100K users, costing 2x-3x the original build.
What Role Does Project Duration Play?
Timeline directly drives burn. An 8-month project at $80K monthly burn costs $640K. A 14-month project at the same rate costs $1.12M. Scope creep adds 15%-25% to timelines on average.
| Software Type | Cost Range | Timeline | Annual Maintenance |
|---|---|---|---|
| Basic SaaS MVP | $30K-$90K | 4-8 months | $40K-$60K |
| Custom Web App | $18K-$50K | 3-5 months | $30K-$50K |
| Enterprise SaaS | $150K-$500K+ | 8-14 months | $50K-$100K |
| High-Complexity AI SaaS | $250K-$1M+ | 12-18 months | $85K-$150K |
| Simple Mobile App | $30K-$60K | 2-3 months | 15%-20% of dev cost |
| Complex Mobile App | $120K-$250K | 6-10 months | 15%-20% of dev cost |
What Are the Main Software Cost Estimation Methods?
Five formal methods give you a structured way to move from requirements to numbers. Variance ranges from 10% to 60% depending on method maturity and calibration.
| Method | Variance | Time Required | Best For | Key Weakness |
|---|---|---|---|---|
| Expert Judgment | 40%-60% | Hours | Small projects under $50K | Two experts can differ by 50%+ |
| Story Points / Agile | 20%-35% | Days | SaaS product teams | Velocity drift from scope creep |
| COCOMO II | 10%-25% calibrated | Weeks | Enterprise systems, regulated environments | Rigid for Agile teams |
| Function Point Analysis | 15%-20% | Days | Business apps, unclear tech stack | Complex for Agile workflows |
| AI-Assisted | 15%-30% | Minutes | Quick baseline estimates | Misses soft complexity, political constraints |
How Does the COCOMO Model Work?
COCOMO II achieves 10%-15% estimation variance with calibration, making it the most accurate method for enterprise platforms exceeding 1 million lines of code. FinTech and HealthTech companies use it for regulatory audits and investor due diligence.
The formula: Effort = 2.94 x Size^E x product of 15 effort multipliers. The 15 multipliers cover product reliability, team capability, and schedule pressure. A high-capability team with good tools reduces effort by 40%+.
Accuracy improves with calibration. Companies that tune constants using 5+ historical projects achieve 10%-15% variance. Without calibration, variance reaches 20%-25%.
How Does Agile Story Point Estimation Work?
Story points measure relative effort, not hours. Teams use the Fibonacci sequence (1, 2, 3, 5, 8, 13, 21) and establish a baseline: “User login is 3 points. Everything else is relative to that.”
Sprint cost formula: (Team Size x Hourly Rate x Sprint Hours) / Velocity. Example: 6 developers x $75/hour x 80 hours/sprint = $36,000 per sprint at 40 points velocity = $900 per story point.
High-performing teams achieve over 80% Planning Accuracy across 5+ sprints. Below 70% consistently signals technical debt or poor requirement definition.
How Does Function Point Analysis Calculate Project Size?
Function Point Analysis achieves 15%-20% variance by measuring functionality delivered to users, not lines of code. It is technology-independent, useful when requirements are clear but the tech stack is undecided.
Five function types form the count: External Inputs, External Outputs, External Inquiries, Internal Logical Files, and External Interface Files. Each receives a complexity weight. Convert final points to effort at 10-20 hours per function point.
Weakness: complex to implement for Agile teams. Requires trained analysts. Different analysts can vary by 15%-20% on the same project.
How Do LATAM Nearshore Costs Compare to US Onshore Rates?
LATAM nearshore offers 60%-70% cost savings versus US hires. Total employer cost for a senior LATAM engineer runs roughly $65,000 fully loaded versus $160,000+ for a comparable US hire.
For teams working with hire software developers in Latin America, time zone alignment is a practical advantage. Mexico City, Bogota, Buenos Aires, and Santiago all operate within 1-4 hours of US Eastern, enabling real-time standups and code reviews without scheduling gymnastics.
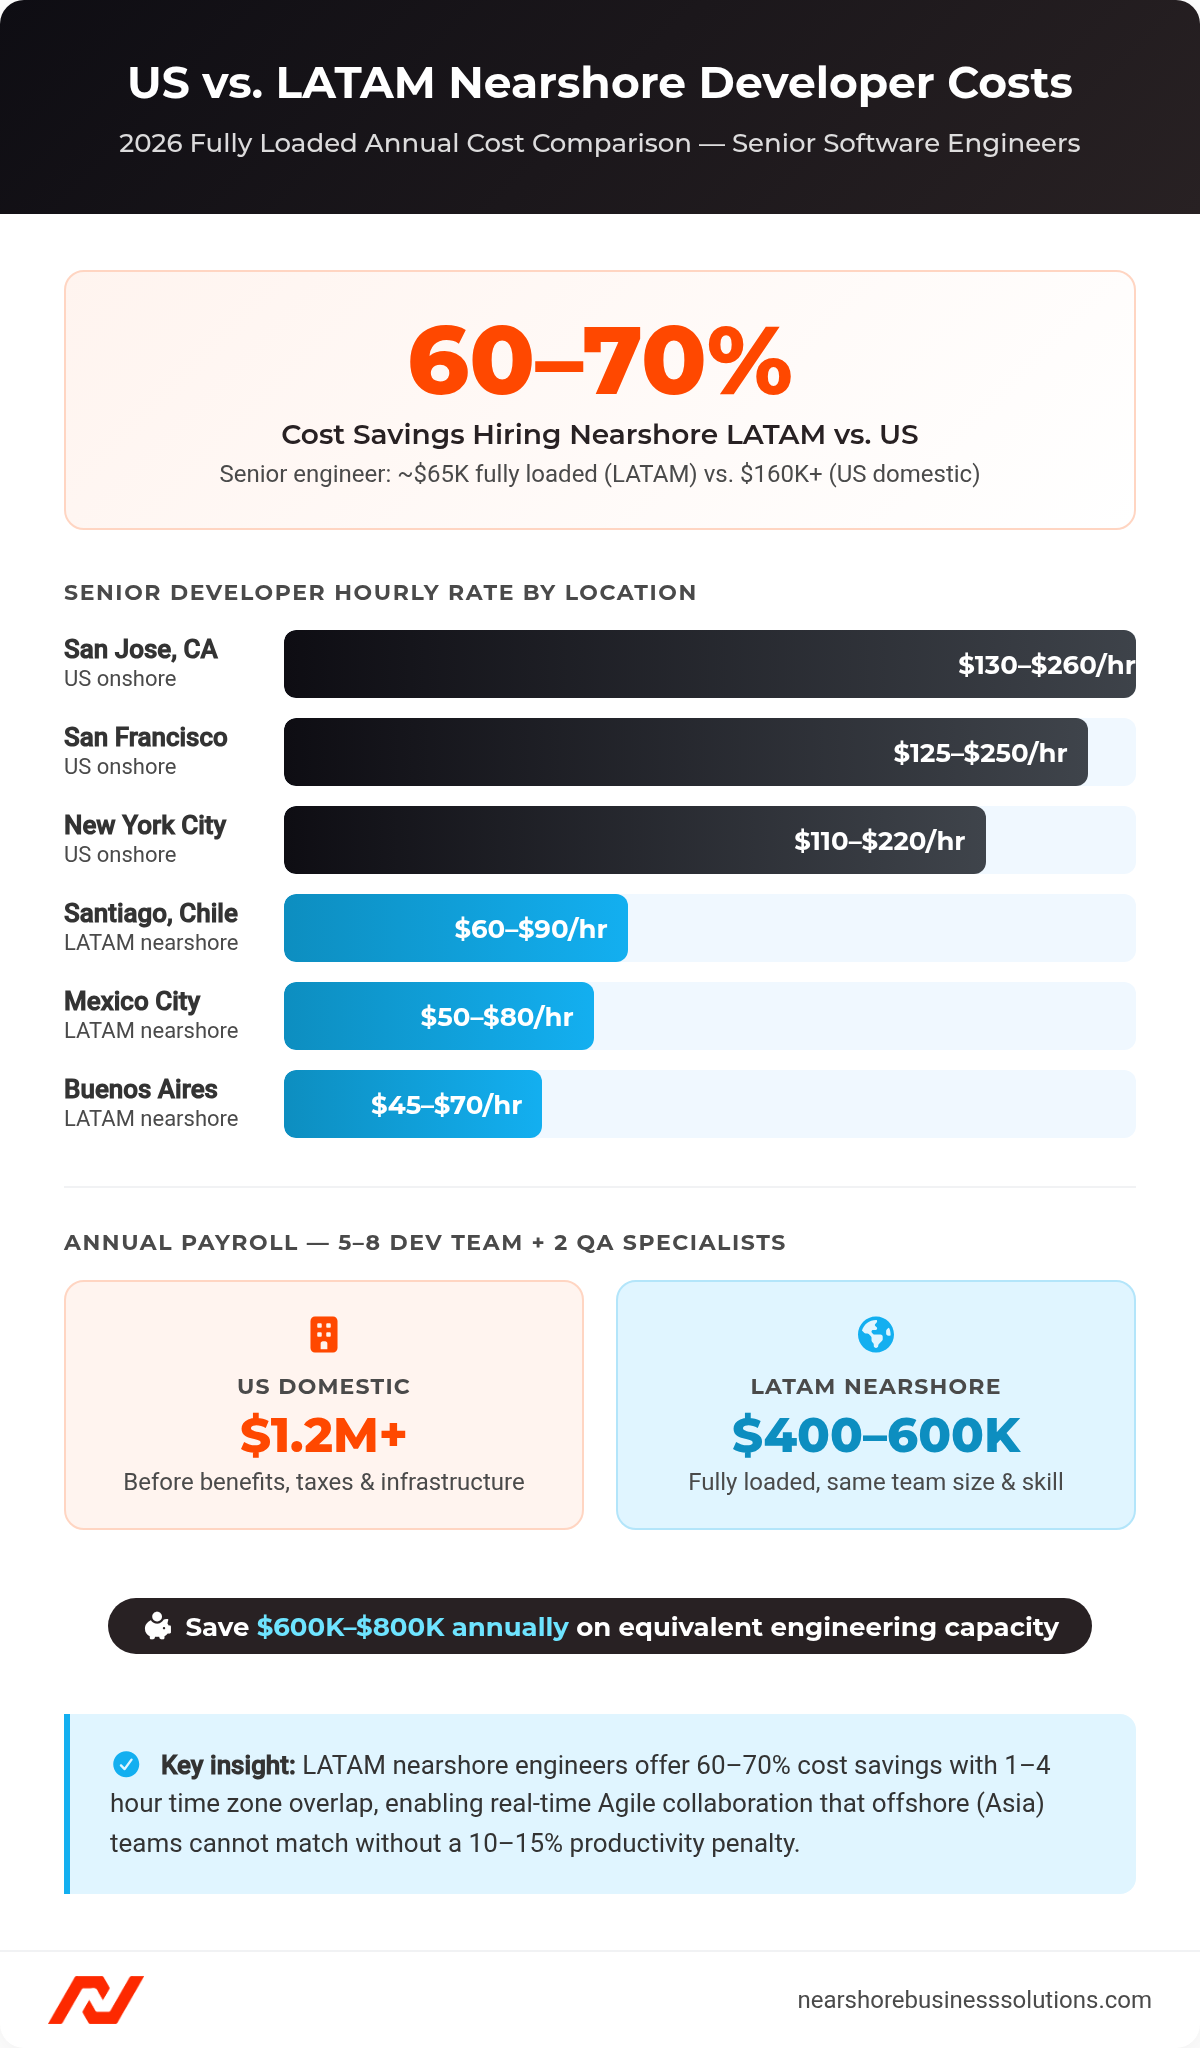
US vs. LATAM developer cost comparison showing 60–70% nearshore cost savings for a 5–8 person engineering team.
What Are Typical Hourly Rates by Region in 2026?
North American Onshore Rates:
| City | Senior Developer | Annual Base |
|---|---|---|
| San Francisco | $125-$250+/hr | $160,870 |
| San Jose | $130-$260+/hr | $180,320 |
| New York City | $110-$220+/hr | $145,280 |
| Austin | $90-$180+/hr | $128,750 |
| National Average | $62-$94/hr | $128,800 |
Latin American Nearshore Rates:
| City | Senior | Mid-Level | QA | Loading Factor |
|---|---|---|---|---|
| Santiago | $60-$90/hr | $35-$55/hr | $30-$55/hr | 1.20x-1.25x |
| Sao Paulo | $55-$85/hr | $35-$55/hr | $30-$50/hr | 1.20x-1.30x |
| Mexico City | $50-$80/hr | $30-$50/hr | $25-$45/hr | 1.15x-1.25x |
| Bogota | $48-$75/hr | $28-$48/hr | $22-$42/hr | 1.15x-1.20x |
| Buenos Aires | $45-$70/hr | $25-$45/hr | $20-$40/hr | 1.10x-1.15x |
Mexico and Brazil hold the largest LATAM talent pools. Developers in Guadalajara (often called Mexico’s Silicon Valley) are trained at Tecnologico de Monterrey (ITESM) and UNAM, two of Latin America’s top engineering schools. Colombia’s Bogota and Medellin, anchored by Universidad de los Andes and the Ruta N innovation district, rank among the top nearshore destinations for US SaaS companies. Argentina produces strong engineering talent from Universidad de Buenos Aires (UBA) and ITBA, with senior developers routinely demanding USD-denominated contracts.
How Does Time Zone Difference Affect Development Costs?
LATAM (1-4 hour difference): 6-8 hours of daily overlap for real-time communication. Enables synchronous standups, sprint planning, and code reviews. Ramp-up time: 4-8 weeks.
Asia (12 hour difference): Questions raised at 3pm EST get answered the next morning. Adds 10%-15% communication overhead. Ramp-up time: 3-6 months.
LATAM nearshore reduces miscommunication by 40%-50% versus Asia offshore, driven by time zone alignment and compatible business practices.
What Hidden Costs Exist in Offshore Development?
Five cost factors are commonly missed.
| Cost Factor | Impact | Details |
|---|---|---|
| Quality Control | +10%-20% timeline | Additional QA cycles for miscommunications |
| Legal and Compliance | $5K-$15K per engagement | International contracts, IP protection |
| Knowledge Transfer | 80-160 senior engineer hours | 2-4 weeks onboarding |
| Turnover Risk | +15%-25% long-term costs | Offshore: 20%-30% attrition vs. LATAM under 15% |
| Management Overhead | $8K-$12K monthly | Dedicated project managers required |
How Do You Perform Software Development Cost Estimation Step by Step?
Eight steps take you from vague requirements to a defensible budget with confidence intervals.
| Step | Action | Key Outputs | Critical Notes |
|---|---|---|---|
| 1. Define Scope | Document functional and non-functional requirements | User stories, wireframes, API specs | Poor definition causes 20%-40% cost increase |
| 2. Determine Size | Measure in KLOC or Function Points | Small: 10K-50K lines; Enterprise: 1M+ | Essential input for COCOMO II |
| 3. Select Technique | Choose based on phase and complexity | Early: Expert judgment; Late: Bottom-up | Hybrid models combining traditional and Agile work best |
| 4. Identify Cost Drivers | Rate COCOMO II’s 15 effort multipliers | Product, Platform, Personnel, Project attributes | High-capability team reduces effort by 40%+ |
| 5. Calculate Effort | Apply selected methodology | Person-months, hours, sprint velocity | Account for team composition and seniority |
| 6. Add Buffers | Build 30%-50% contingency | $400K base becomes $520K-$600K | IT projects overrun budgets by 75% on average |
| 7. Validate | COCOMO sanity check vs. story points | Planning Accuracy target: over 80% | If methods diverge 2x, investigate scope gaps |
| 8. Present | Three scenarios with ranges | Optimistic, most likely, pessimistic | Avoid false precision; include confidence intervals |
How Do You Define Scope to Prevent Cost Overruns?
Poor requirement definition causes 20%-40% cost increases through rework, scope creep, and missed dependencies. Document functional requirements (user login, payment processing, reporting) and non-functional requirements (99.9% uptime, HIPAA compliance, under 200ms response time).
Establish a change control process before work begins. All scope additions require written approval and budget adjustment. Scope creep adds 15%-25% to timelines. Each 10% scope increase adds 15%-20% to timeline.
How Do You Account for Risks and Uncertainties?
IT projects overrun budgets by 75% on average. Build risk-based contingency alongside flat buffers.
Use expected value calculations:
- Regulatory changes: 15% probability x $50K impact = $7.5K
- Vendor delays: 25% probability x $30K impact = $7.5K
- Scope expansion: 40% probability x $80K impact = $32K
- Total risk reserve: $47K
For a $400K base estimate, present $520K-$600K to stakeholders. Reserve 20%-30% for scope changes and technical surprises.
What Cost Estimation Tools Are Available in 2026?
Three tool categories cover the range from AI-speed estimation to enterprise parametric modeling.
What Are AI-Powered and Parametric Estimation Tools?
AI-assisted tools (GitHub Copilot Workspace, Atlassian Intelligence) analyze codebases and surface similar past projects in minutes. Variance: 15%-30%. Key weakness: they miss soft complexity like political constraints, legacy system dependencies, and team dynamics.
COCOMO calculators (USC COCOMO II.2000, custom spreadsheets) automate parametric modeling. Input: KLOC, scale factors, effort multipliers. Output: person-months, schedule, team size. Free university calculators exist. Commercial options ($500-$2,000) include calibration modules.
Use AI estimates as a starting point. Validate with COCOMO or Function Points before presenting to stakeholders.
What Project Management Platforms Support Estimation?
For full-stack developer teams running Agile, platform choice shapes estimation workflow.
| Tool | Price/User/Month | Best For | Key Features |
|---|---|---|---|
| Jira Enterprise | $8.60-$17 | Complex regulated environments, 100+ teams | 3,000+ integrations, Advanced Roadmaps, AI grooming |
| Linear | $8-$12 | Product teams valuing speed | Sub-200ms response, story points, velocity tracking |
| ClickUp | $7-$12 | Small to mid-sized cross-functional teams | All-in-one docs, wikis, time tracking |
What Is Software Budget Planning?
Effective budget planning starts with contingency, then builds out maintenance schedules and iterative phase allocations.
What Is the Typical Split Between Development and Post-Launch Costs?
Year 1 total cost of ownership for a $200K project:
- Development: $200K (72%)
- QA/Testing: $40K (14%)
- Initial cloud hosting: $12K (4%)
- Compliance/security setup: $15K (5%)
- AI infrastructure setup: $10K (4%)
- Year 1 total: $277K
Recurring annual costs (Year 2+) run $87K-$168K. Development represents only 24% of 3-year TCO. Budget increases 10%-20% year-over-year as user base grows and infrastructure scales.
How Do You Plan for Iterative Development?
Allocate 40%-60% of total budget to post-MVP iterations. For a $300K budget, spend $120K-$150K on MVP. Reserve $150K-$180K for enhancements based on user feedback.
Phase budgets by quarter: Q1 core features (40%), Q2 beta launch (25%), Q3 feature expansion (20%), Q4 optimization (15%).
Track burn rate weekly. $300K over 9 months = $33K monthly target. If burning $45K/month, runway is 6.7 months, not 9.
How Has Software Development Cost Estimation Changed in 2026?
Four technology shifts have changed the estimation equation in ways that require updated budget assumptions.
AI code generation accelerates coding by roughly 30%. But only 32.7% of AI-generated PRs are accepted without significant rework, versus 84.4% for manual code. Teams without strict QA see 25%-40% defect escape rates. Net impact: 15%-20% overall savings when QA is maintained, or 30%+ cost increase when it is skipped.
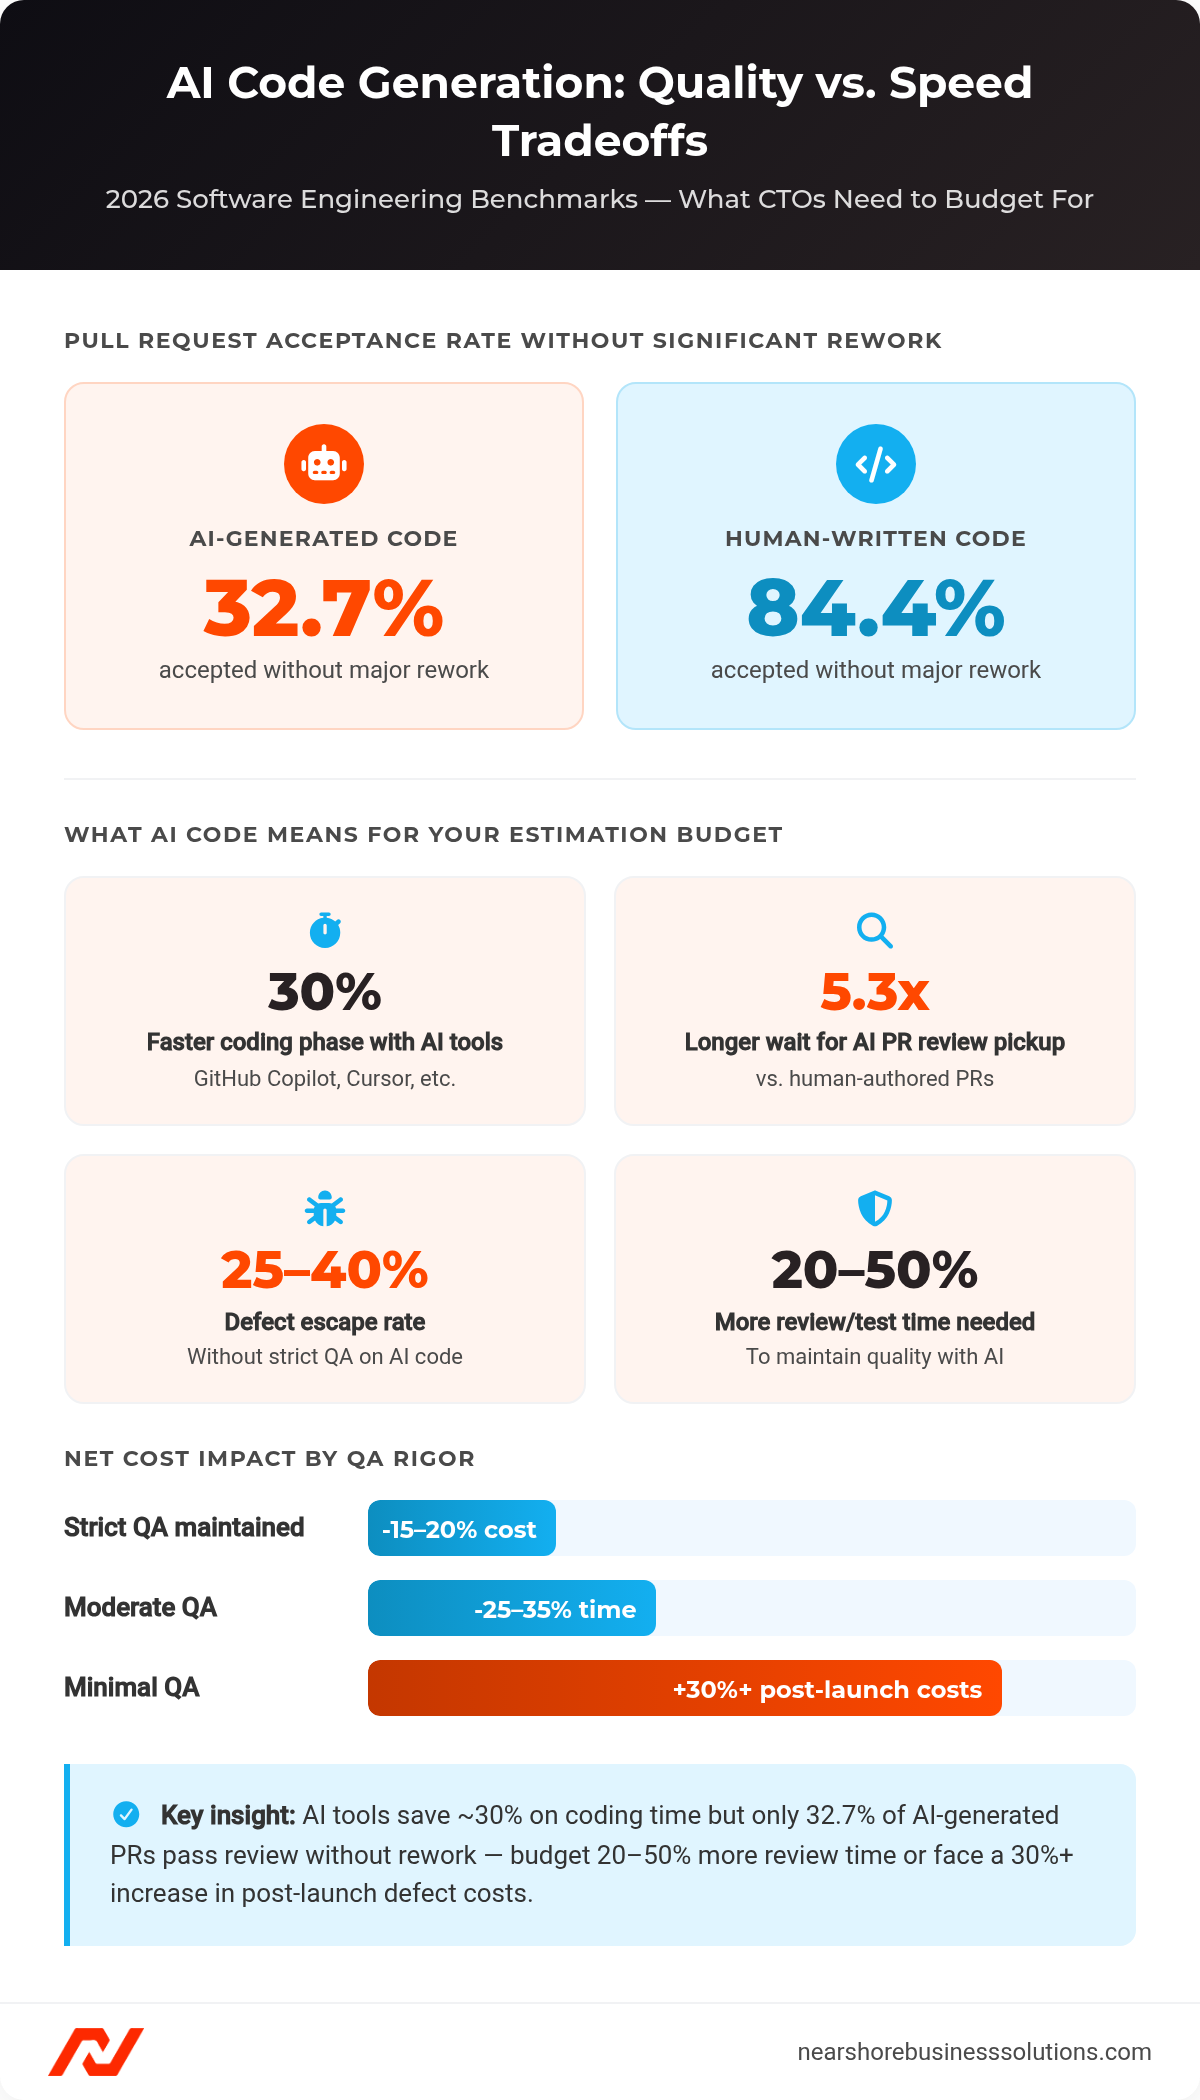
AI code generation quality metrics showing 32.7% PR acceptance rate versus 84.4% for human code and the budget impact of QA rigor.
Low-code platforms (OutSystems, Mendix, Bubble) reduce development time by 40%-60% for CRUD applications. Break-even with custom development: 5-7 years. Risk: vendor lock-in means migrating to custom code costs 2x-3x the original platform build.
DevOps and CI/CD reduce time-to-market by 20%-40% and lower operational costs by 15%-25%. Initial investment: $30K-$80K for pipeline setup. Benefits: deploy 10x-100x more frequently with 50% lower failure rate.
What Common Mistakes Occur in Software Cost Estimation?
Six mistakes cause most budget overruns. All are preventable with process changes.
- Scope creep: Adds 15%-25% to timelines. Prevent with a formal change request process requiring executive approval for changes over 5% of budget.
- QA underestimation: Teams that cut QA create debt costing 3x-5x more post-launch. Teams using AI code generation without strict QA see 25%-40% defect escape rates.
- Poor requirements: Cause 20%-40% cost increase through rework. Invest 10%-15% of budget in requirements with prototypes and documented acceptance criteria.
- Optimism bias: Teams ignore meetings, code reviews, and debugging that consume 30%-40% of workdays. Counter with reference class forecasting from similar past projects.
- Technical debt: Increases maintenance costs by up to 60% and consumes 33% of developer time. High-performing teams allocate 20% of capacity to debt reduction.
- Integration complexity: Third-party integrations add 80-200 hours each ($8K-$20K at $100/hour). Budget 15%-25% of project cost for systems with 5+ external dependencies.
How Do You Compare Software Development Estimates from Different Vendors?
Seven criteria separate credible estimates from guesswork.
- Methodology used: COCOMO II (10%-25%) is more reliable than Expert Judgment (40%-60%). Ask how they estimated and at what phase.
- Team composition: Senior-heavy teams (80%+ senior) deliver 20%-30% faster but cost 40%-60% more. Verify actual team, not theoretical capacity.
- Geographic cost structure: LATAM offers 60%-70% savings versus US with 1-4 hour overlap. Compare fully-loaded costs including benefits and taxes.
- Maintenance inclusion: Does the estimate include QA (20% of dev), year-one maintenance ($40K-$60K), cloud hosting ($12K-$48K), and compliance ($10K-$20K)? If not, add 30%-50%.
- Low estimate red flags: 30%+ below industry benchmarks suggests missing scope, a junior team, or a loss leader with change orders planned.
- Padded estimate red flags: Contingency over 40%, vague feature-level breakdown, or PM overhead exceeding 15%.
- Attrition rate: Ask any LATAM partner for their annual attrition rate. Quality providers maintain under 15%. High turnover adds 15%-25% to your costs through knowledge loss and ramp time.
For backend developer roles with compliance requirements, ask for references from projects with similar regulatory scope (HIPAA, SOC 2, PCI DSS).
Frequently Asked Questions About Software Development Cost Estimation
These are the most common questions CTOs and VPs of Engineering ask when building a cost estimation framework.
How Long Does It Take to Get an Accurate Estimate?
It takes 1-4 weeks to produce a reliable estimate with 15%-25% variance. Initial expert judgment estimates take hours but carry 40%-60% variance. Parametric models like COCOMO II take weeks but achieve 10%-25% variance. Plan for iterative refinement at each project phase gate.
What If Our Requirements Change Mid-Project?
You should establish a formal change control process before work begins. Any scope addition over 5% of budget requires written approval and a re-estimate. Scope creep adds 15%-25% to timelines on average. Budget a 20%-30% contingency reserve specifically for mid-project changes.
Do We Need a Local Entity to Hire LATAM Developers?
No, you do not need a local entity. Employer of Record (EOR) services let you hire in Mexico, Colombia, Argentina, and Brazil in 3-7 days without establishing a legal presence. EOR providers handle local payroll, taxes, and compliance. Entity setup takes 30-90 days and $15K-$50K in legal fees.
How Do We Pay LATAM Developers?
Pay through an EOR provider or a nearshore staffing firm that handles local payroll. Payments are typically in USD for Argentina and in local currency for Mexico and Colombia. Most firms invoice in USD with payment via wire transfer or ACH. Payment terms are usually Net 15 to Net 30.
What Is the Difference Between Nearshore and Offshore Development?
Nearshore means your team is in a nearby country with 1-4 hours of time zone difference. Offshore typically means 8-12 hours of difference. Nearshore enables synchronous Agile collaboration and reduces communication overhead by 40%-50%. Offshore offers slightly higher savings (70%-80% versus 60%-70%) but adds 10%-15% productivity loss from time zone friction.
What Happens If a Developer Does Not Work Out?
A reputable nearshore partner offers a 90-day replacement guarantee at no additional cost. Ramp-up for a LATAM replacement takes 4-8 weeks, versus 1-2 months for a US hire through traditional recruiting.
How Much Should We Budget for AI Development in 2026?
Budget $250K-$1M+ for high-complexity AI SaaS over 12-18 months. Annual maintenance runs 17%-30% of initial development. Infrastructure alone costs $8K-$15K per month for medium-scale deployment. The typical breakdown: 30% data engineering, 25% model development, 20% inference infrastructure, 15% monitoring, 10% integration.
Ready to Optimize Your Engineering Budget?
Nearshore Business Solutions sources and vets developers from Mexico City, Bogota, Buenos Aires, and Sao Paulo. We screen for technical skills, English fluency, and US work style fit. Our acceptance rate is 16%.
Every placement includes a 90-day replacement guarantee. You receive pre-vetted candidates in 2-4 weeks.
Get a free consultation to discuss your hiring needs and receive a custom quote.