
An offshore development center (ODC) is a dedicated engineering team that works as a permanent extension of your org. Deloitte reports 82% of Fortune 500 companies run at least one. A nearshore ODC in Latin America often beats traditional offshore on total cost of ownership, not hourly rate.
The global IT outsourcing market reached $586.6 billion in 2023, heading to $904.9 billion by 2028 (Mordor Intelligence, 2024). Everest Group’s 2023 data shows LATAM nearshore now wins 38% of new US-company ODC engagements. The reason is TCO, not the quoted rate.
This guide breaks the ODC model into structure, build phases, real cost anatomy, and the nearshore case. You get the framework to evaluate any vendor proposal against the metrics that actually drive ROI. For broader context, see our guide on nearshore IT solutions.
What Does the ODC Model Get Right, and Why Do CTOs Still Choose It Over Freelance Outsourcing in 2026?
An ODC is a dedicated team that operates as a legal or functional extension of your engineering org, housed in a lower-cost geography. Accelerance (2023) uses the term Dedicated Development Center interchangeably. The operative word is dedicated.
These engineers work only on your products. They attend your standups, merge into your repos, and build domain knowledge over years. That structural commitment separates the model from project outsourcing, which rotates developers per deliverable. It also separates it from basic staff augmentation, which adds headcount with no ownership. Our breakdown of staff augmentation vs nearshoring covers where each model fits.
Gartner’s 2023 “Market Guide for Offshore/Nearshore Development Services” classifies ODC maturity across five levels. Level 1 is resource augmentation, cost-focused. Level 5 is an innovation hub that co-owns product R&D. CTOs who treat an ODC as a pure cost play stall at Level 1. Gartner recommends targeting at least Level 3, Managed Services, where the ODC owns specific functions and ships on its own.
Three forces sustain CTO demand for this model in 2026. US senior engineer scarcity tops 500,000 unfilled software roles, per CompTIA’s 2024 tech jobs analysis. Compensation pressure pushes Bay Area senior full-stack salaries past $210,000 fully burdened (Levels.fyi, 2024). And teams need durable capacity that compounds institutional knowledge. Freelancers churn. Agencies rotate. A dedicated ODC retains.
How Do Captive Center, Build-Operate-Transfer, and Hybrid ODC Structures Compare?
Each ODC ownership model trades setup speed against long-term control. The dedicated team model deploys in 1 to 3 months. A captive center can take 12 to 18 months but gives you total control.
| Dimension | Captive Center | Dedicated Team (Vendor) | Build-Operate-Transfer (BOT) |
|---|---|---|---|
| Setup Timeline | 12 to 18 months | 1 to 3 months | 12 to 24 months (to transfer) |
| Upfront Investment | $500K to $2M+ | $10K to $50K | $100K to $500K |
| Ongoing Cost/Engineer/Month | $6,000 to $12,000 (fully burdened) | $5,500 to $10,000 (all-inclusive) | $6,500 to $11,000 (operate phase) |
| Control Level | Total | High (you run ops, vendor handles HR/admin) | Medium to Total |
| IP Ownership | Direct via subsidiary | Client owns via work-for-hire MSA | Client owns from day one |
(Sources: Everest Group, 2023; Kearney, 2023; internal NBS vendor pricing analysis)
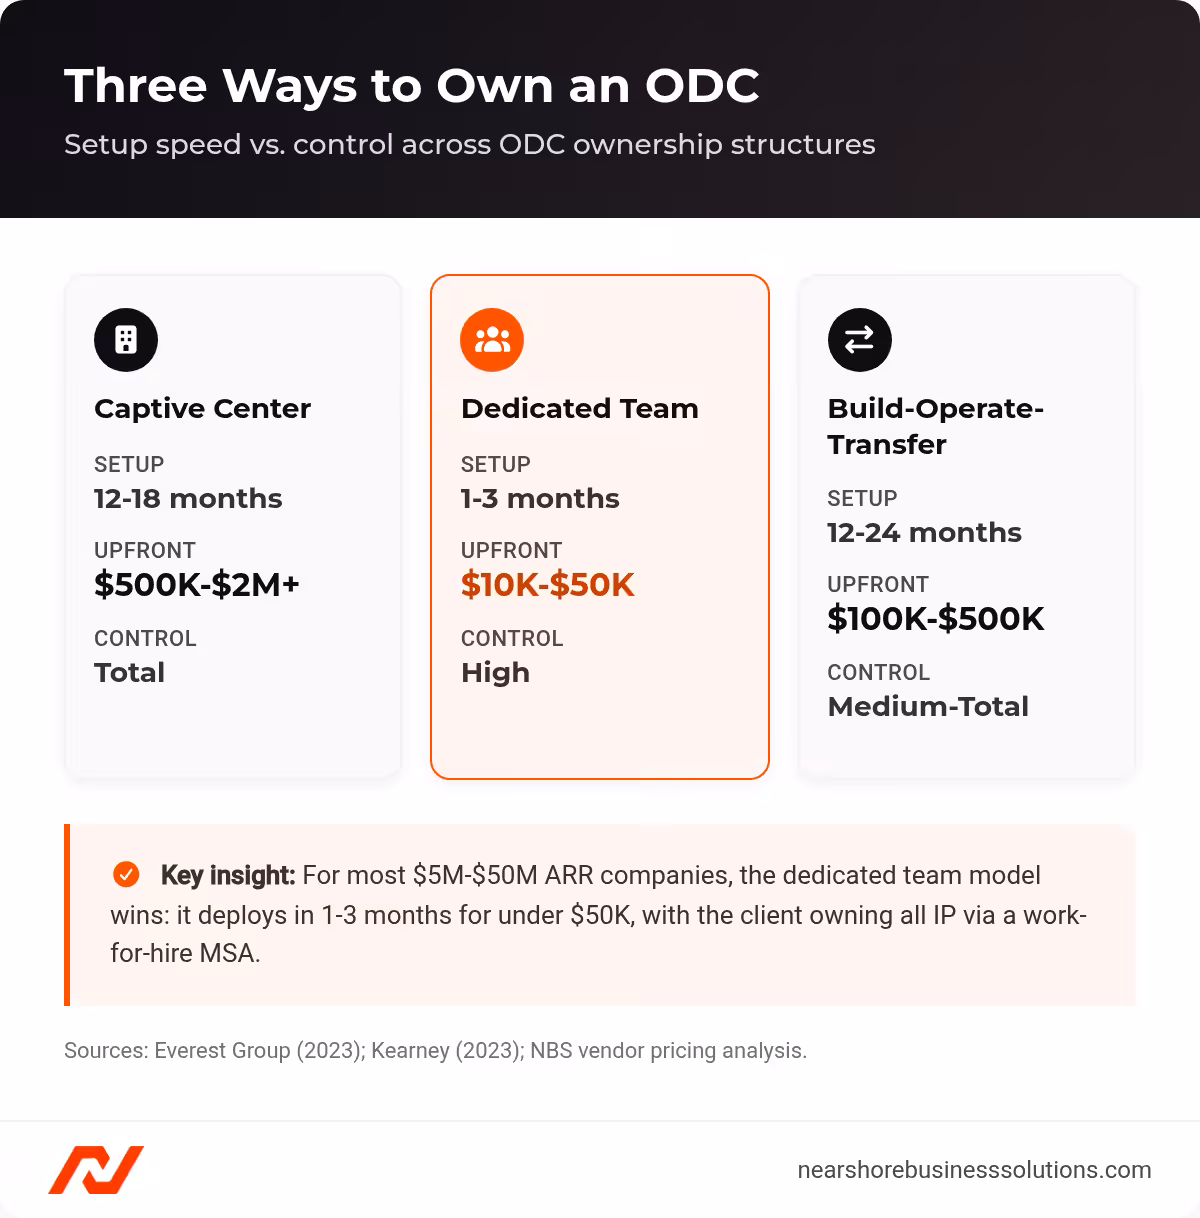
Setup time, upfront cost, and control across three ODC ownership structures.
The dedicated team model dominates for CTOs between $5M and $50M ARR. It deploys fastest, needs the least upfront capital, and gives enough control for most product engineering workflows. Captive centers make sense above $50M ARR when you need 50 or more engineers. BOT bridges the gap. You start vendor-managed, then absorb operations once you have validated the talent market.
IP ownership is structurally different across these models. In a dedicated team arrangement, the standard MSA includes a full and irrevocable assignment of all intellectual property to the client. In a BOT model, IP assigns to the client from day one. The eventual transfer is operational, not a transfer of intellectual property. In a captive center, your foreign subsidiary directly owns all IP under your US parent. That is the most airtight structure available.
How Do You Build an ODC in 5 Phases, From Gap Analysis to Steady-State Operations?
You build an ODC in five phases that move from an engineering gap on your org chart to a fully integrated team. The number of dedicated development centers established for US companies in Latin America surged from roughly 400 in 2020 to an estimated 950+ by end of 2024, a 137% increase tracking a 14.5% CAGR in the LATAM nearshore market (IDB/Kearney analysis).
- Engineering Gap Analysis and Role Mapping. Identify which roles belong in the ODC versus in-house.
- Location and Partner Selection. Evaluate geography across time zone overlap, talent depth, and cost.
- Legal and IP Scaffolding. Establish IP assignment, compliance certifications, and the contractual framework.
- Recruitment and Onboarding Ramp. Integrate dedicated engineers into your sprint cadence and codebase.
- Operational Maturity and KPI Integration. Bring the ODC into steady-state operations with shared metrics.
Start with the roles, not the geography. CTOs who lead with “find me cheap developers” end up with a cost-optimized team that cannot ship on its own. High-collaboration, low-IP-sensitivity functions deliver the highest ROI in a nearshore ODC. These include feature engineering, front-end development, QA automation, and DevOps. Core platform engineering with trade-secret algorithms belongs in-house or in a captive center. For teams still deciding how to source and screen that talent, our guide to how to hire offshore software developers covers scoping requirements and vetting candidates end to end.
Once you have mapped functions, evaluate geography. LATAM’s combined developer pool exceeds 1.5 million engineers and grows about 7% annually (IDB/Kearney analysis, 2023). Colombia’s 8.2% YoY developer growth is the fastest in the region. Argentina’s EF EPI score of 560 (High proficiency, #28 globally on the 2023 index) makes it the strongest English-language market in LATAM. Mexico’s USMCA treaty creates the most robust bilateral IP enforcement framework available to US companies in the region. FDI in LATAM technology sectors grew an estimated 25% YoY in 2023 (IDB/Kearney analysis).
Phase 4, recruitment and onboarding, is where most CTOs underestimate TCO. Expect 60 to 70% of target sprint velocity in month one, 80 to 85% in month two, and full velocity by month three or four with structured onboarding (NBS data across our ODC placements). Zapier’s LATAM hiring operations reported time-to-hire 40% faster than comparable US roles. A 10-engineer ODC running at 65% velocity for 8 weeks instead of 4 wastes roughly 200 engineering hours, or $40,000 to $80,000 in burned capacity. Our nearshore team implementation guide details the onboarding sprint structure that compresses the ramp from four months to under three.
A mature ODC (Gartner’s Level 3+) disappears as a separate entity in your engineering metrics. It shares standups, a unified toolchain, a single backlog, and identical DORA targets regardless of location. DORA’s 2023 State of DevOps Report confirms that distributed teams sharing one CI/CD pipeline and unified code ownership show no statistically significant degradation on deployment frequency, lead time, change failure rate, or mean time to restore versus co-located teams. The bottleneck is process discipline, not physical proximity.
What Does the Offshore Development Center Cost Structure Hide Behind the Quoted Hourly Rate?
The quoted hourly rate hides five costs: burden multipliers, ramp loss, time zone management overhead, attrition-driven re-recruitment, and compliance maintenance. A $4,500 per engineer monthly quote is not the number on your P&L twelve months later.
The burden multiplier varies by geography. It runs 1.4x to 1.6x in Latin America, driven by mandatory social security, health and pension contributions, and 13th or 14th-month salary obligations. It runs 1.2x to 1.35x in India and 1.25x to 1.4x for US domestic hires (Velocity Global/Papaya Global, 2024).
Model a 10-person ODC and compare the quoted cost against the true loaded cost. The nearshore Colombia option carries a higher base than India but a lower true TCO once you price time zones and attrition.
| Line Item | Colombia (Nearshore) | India (Offshore) | US Domestic |
|---|---|---|---|
| Base Salaries (10 engineers) | $590,000 | $385,000 | $1,780,000 |
| Loaded Salary Cost | $885,000 | $492,800 | $2,349,600 |
| Ramp Productivity Loss | $73,750 | $73,750 | $37,000 |
| Management Overhead | $36,000 | $96,000 | $0 |
| Annual Attrition Replacement | $53,100 | $118,560 | $112,320 |
| Travel and Compliance | $27,000 | $55,000 | $5,000 |
| True Annual TCO | $1,074,850 | $836,110 | $2,503,920 |
| Δ vs. Quoted Base | +82% | +117% | +41% |
(Salary sources: Glassdoor Mar 2024, Levels.fyi Feb 2024, Arc.dev 2024, Terminal 2024)
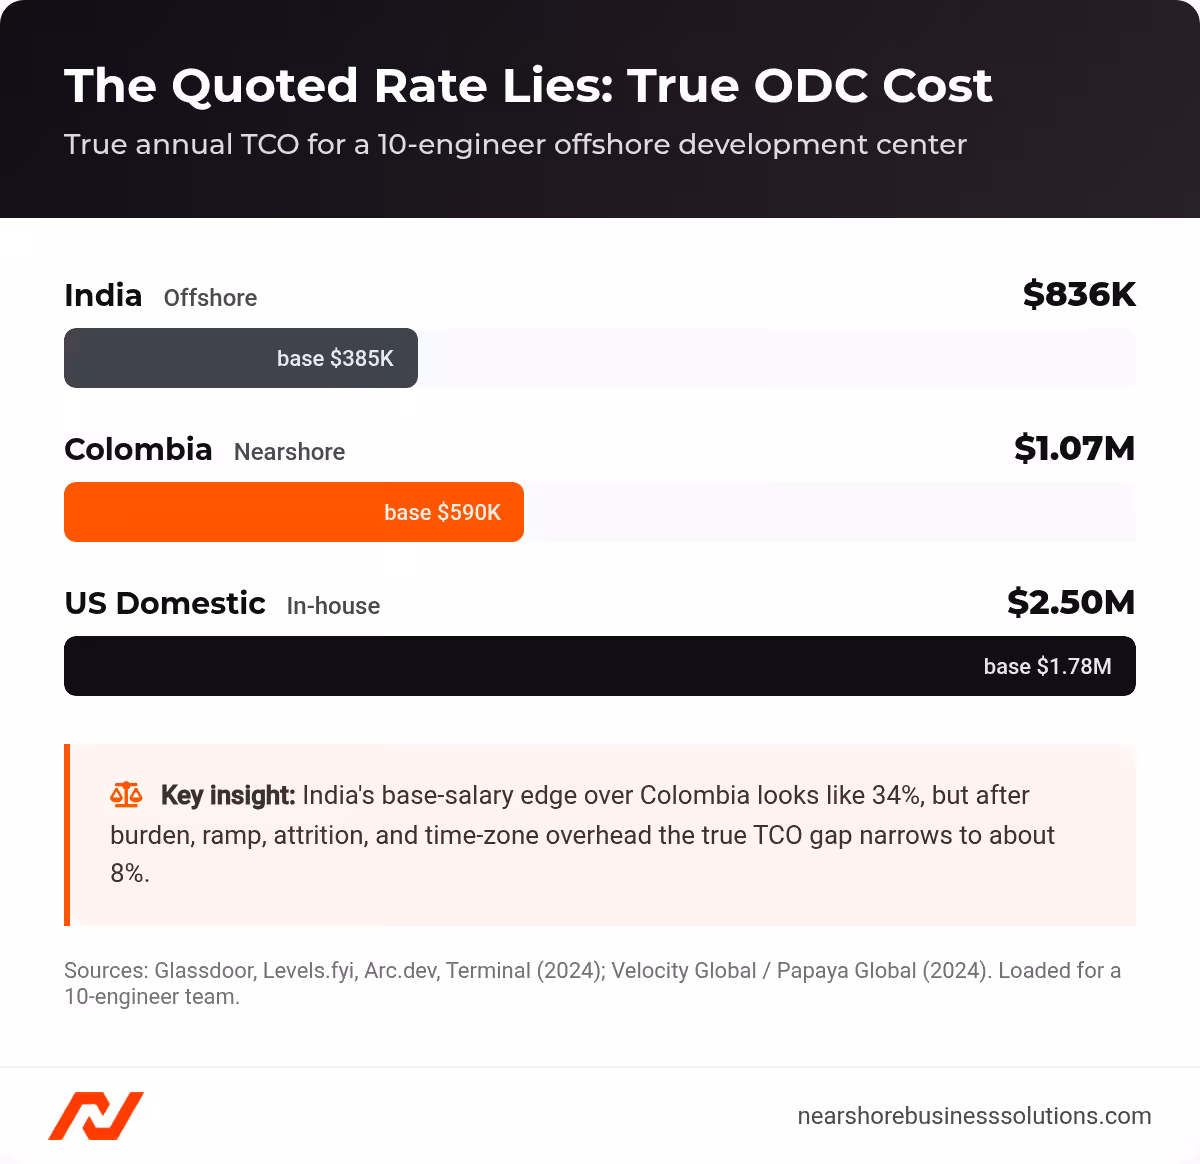
True annual total cost of ownership for a 10-engineer ODC across India, Colombia, and US.
India looks cheaper by $238,740 on this view. That gap shrinks once you price the time zone tax and attrition drag. For a deeper rate breakdown, see our nearshore development pricing models guide.
How Does Time Zone Misalignment Become a Financial Variable?
Time zone overlap converts directly into merge speed and senior management hours. Microsoft Research (2021) found PRs from engineers in misaligned time zones took 50% longer to merge.
| City | vs. US Eastern | vs. US Central | vs. US Pacific |
|---|---|---|---|
| Bogotá (Colombia) | 0 hrs (full overlap) | 1 hr | 2 to 3 hrs |
| Mexico City | 1 hr | 0 hrs (full overlap) | 2 hrs |
| Buenos Aires (Argentina) | 2 hrs | 3 hrs | 5 hrs |
| Bangalore (India) | 9.5 to 10.5 hrs | 10.5 to 11.5 hrs | 12.5 to 13.5 hrs |
A study in the Journal of Software: Evolution and Process (2019) quantified the broader penalty. Teams with fewer than 4 overlapping hours saw a 15 to 20% productivity loss on complex collaborative tasks. GitLab’s 2023 Remote Work Report confirmed the pattern, with respondents citing decision-making delays as the top pain point for teams spread across 5 or more time zones.
When your US engineering lead spends 1.5 to 2 hours daily on async handoffs and chasing reviews across a 10-hour offset, that redirects 7.5 to 10 hours of senior time weekly. At $120 per hour fully burdened, management overhead for a 10-person offshore team in India runs about $96,000 per year, versus $36,000 for the same team in Colombia. That $60,000 delta alone closes 25% of the quoted cost gap.
How Does Attrition Erode ODC ROI?
Attrition is the recurring cost that resets your ramp clock and erases retained knowledge. Indian offshore providers average 20 to 30% annual attrition for technology roles, with some large firms exceeding 40% (Mercer, 2024; Aon Hewitt, 2023). Latin American tech markets average 12 to 18% (Mercer, 2024).
SHRM (2022) estimates total replacement cost at 6 to 9 months of annual salary per departure. At India’s 25% midpoint, you replace 2.5 engineers a year from a 10-person team. At Colombia’s 15% midpoint, you replace 1.5. The net attrition cost differential favors LATAM by roughly $65,000 per year. Every replacement also resets the 3 to 4 month ramp clock, during which the surrounding team absorbs mentoring load that appears on no invoice. After three years, the retained-knowledge gap between an 85%-retention team and a 70%-retention team is the difference between an autonomous engineering unit and a permanent onboarding operation.
What Is the Total Cost of Ownership Formula for an ODC?
Use this formula and request the same breakdown from every vendor:
TCO = (Loaded Monthly Rate × Team Size × 12) + Ramp Cost + Attrition Replacement Cost + Management Overhead + Travel and Compliance
Apply it to the 10-person scenario and the picture inverts from the vendor pitch. India’s quoted base-salary advantage of $205,000 per year shrinks to roughly $88,000, an 8.2% gap, not the 34% the base salaries implied. For teams where complex collaborative work dominates, the 15 to 20% productivity loss on sub-4-hour-overlap teams erases even that residual margin. Any partner who cannot decompose pricing into these components is hiding margin in the line items they omit.
Why Does a Nearshore Development Center Outperform Traditional Offshore?
A nearshore development center outperforms traditional offshore because it removes the three failure modes that erode offshore ODC ROI: time zone drag, cultural friction, and attrition-driven knowledge loss. Everest Group’s Q3 2023 data shows India’s share of US-company offshore resources holding flat at 55 to 60% while Eastern Europe declined from about 15% to about 12%. LATAM absorbed that shift.
A nearshore ODC converts time zone alignment into daily operational gains. Your Bogotá engineer joins your 9:30 AM Eastern standup at 9:30 AM local time. No Loom recordings, no 18-hour feedback loops. Code reviews happen synchronously. Production incidents trigger same-timezone war rooms. Sprint planning includes every engineer, which eliminates the information asymmetry that plagues split-timezone retros.
On technical capability, LATAM talent is globally competitive. HackerRank’s 2023 Developer Skills Report ranks Brazil and Argentina in the top 20 globally for algorithm challenges. Coursera’s 2023 Global Skills Report places Argentina #1 in Latin America and #22 globally for technology skills, with Brazil #18 globally for data science, ahead of India at #35. Tech stacks across the region align with US demand: JavaScript (React, Node.js), Python, Java, .NET, and growing depth in AWS, Azure, and GCP.
The structural retention advantage compounds these gains. A well-structured nearshore ODC offers LATAM engineers competitive local pay, career growth, and the prestige of embedded roles with US tech brands. That makes the employer a destination in markets where few companies offer the combination. Zapier scaled its engineering team by over 200% from 2020 to 2023, hiring heavily across Colombia, Mexico, and Argentina while holding a high talent bar. That retention dynamic, 12 to 18% attrition versus 20 to 30% offshore, means your nearshore ODC accumulates domain knowledge, codebase fluency, and cross-team relationships that a higher-attrition ODC rebuilds perpetually.
Everest Group’s conclusion is direct. The roughly 8% direct cost advantage of India is likely erased by the 15 to 20% productivity loss from near-zero time zone overlap. For agile teams that rely on daily standups, pair programming, and quick feedback loops, the nearshore advantage is a significant ROI driver. CTOs who model TCO correctly choose the geography that optimizes total delivered output per dollar, not the lowest line item on page one.
Frequently Asked Questions About Offshore Development Centers
These are the most common questions CTOs ask when evaluating an offshore or nearshore ODC.
How Long Does It Take to Build an ODC?
It takes 1 to 3 months with a dedicated team vendor, 12 to 18 months for a captive center, and 12 to 24 months for a full Build-Operate-Transfer. The vendor-managed dedicated team model is the fastest path to a productive team for most $5M to $50M ARR companies.
Who Owns the IP an ODC Produces?
Your company owns it in every well-structured model. A dedicated team MSA includes a full, irrevocable IP assignment to the client. In a BOT or captive structure, IP assigns from day one through your subsidiary or work-for-hire terms.
Is a Nearshore ODC Really Cheaper Than India?
Often yes, once you measure total cost of ownership instead of base salary. India’s base-rate advantage of about 34% shrinks to roughly 8% after burden, ramp, attrition, and management overhead, and the 15 to 20% productivity loss from low time zone overlap can erase that residual.
What Functions Should You Put in an ODC First?
Start with high-collaboration, low-IP-sensitivity functions: feature engineering, front-end, QA automation, and DevOps. Keep trade-secret core platform work in-house or in a captive center until the ODC reaches Gartner Level 3 maturity.
How Do You Keep ODC Attrition Low?
Offer competitive local compensation, real career growth, and embedded roles tied to a US tech brand. Nearshore LATAM markets average 12 to 18% attrition versus 20 to 30% offshore, which protects retained domain knowledge.
Do You Need a Local Entity to Run an ODC?
Not with a dedicated team or BOT model. The vendor holds the local entity and handles HR, payroll, and compliance, while you direct the engineering work. A captive center requires you to establish your own foreign subsidiary.
Ready to Build Your Nearshore Development Center?
Nearshore Business Solutions sources and vets dedicated engineers across Colombia, Mexico, and Argentina for US companies building an ODC. We screen for technical skills, English fluency, and US work-style fit, and every placement includes a 90-day replacement guarantee.
Start with our remote talent acquisition service to scope your team, or explore staff augmentation for faster ramp.
Get a free consultation to model your ODC’s total cost of ownership and receive a custom quote.