
The global IT outsourcing market hit $620.3 billion in 2022 and is projected to reach $1.3 trillion by 2030 (Grand View Research). The Latin American IT services segment alone is growing at 8.36% CAGR toward $128.1 billion by 2029, driven by North American demand for nearshore services (Statista, 2024).
The real gap between nearshore and offshore shows up in five operational dimensions that compound each other: loaded cost, time-zone overlap, communication bandwidth, talent quality and retention, and IP/legal risk posture. A 40% rate discount means nothing if async handoff delays add two weeks to every release cycle. This article quantifies every variable that determines total cost of ownership, not just the two that appear on a vendor’s pricing slide.
What Is the Real Difference Between Nearshore and Offshore in 2026?
Nearshore outsourcing means partnering with teams in nearby countries within 1 to 3 time zones of your headquarters. For US companies, that is Latin America. Offshore outsourcing means contracting teams across 8 to 12 time zone gaps, typically in India or the Philippines. Geography is the least interesting variable separating the two, and the least predictive of outcomes. Confusing the two models is the first of several common myths about nearshoring in Latin America worth clearing up.
What Does Nearshore Mean for Same-Day Collaboration Within 1 to 3 Time Zones?
Real-time collaboration is the core product of a nearshore model, not a side benefit. When a US Eastern Time team works with developers in Mexico City (UTC−6), Bogotá (UTC−5), or Buenos Aires (UTC−3), daily overlapping windows range from six to eight working hours. That overlap means same-morning standups, live PR reviews before lunch, and Slack threads that resolve in minutes instead of overnight.
Latin America backs that time-zone advantage with scale. The region’s developer pool exceeds 1.5 million (Inter-American Development Bank, 2023) and grows at 10 to 12% annually. That is one of the fastest expansion rates globally, driven by government investment in STEM education and a young demographic (Evans Data Corporation, 2023).
What Does Offshore Mean for Cost Arbitrage Across 8 to 12 Time Zone Gaps?
Rate-card savings of 60 to 75% versus US domestic hiring make offshore destinations economically compelling on a spreadsheet (Deloitte, 2023). India fields roughly 5.2 million developers, the world’s largest talent pool (NASSCOM, Statista). At volume, these markets staff large teams fast.
Zero overlapping business hours with US Eastern Time is the structural constraint. Bangalore and Manila sit 9.5 to 13 hours ahead, so every interaction defaults to async. Each handoff cycle adds 12 to 24 hours of latency per decision. Deloitte’s own assessment flags the gap: the 60 to 75% savings figure “does not account for potential productivity losses or higher TCO due to communication gaps and attrition.”
Why Does the Old Nearshore Offshore Comparison Framework Fail in 2026?
Hourly rate and time-zone map are the two axes most comparison articles use. They ignore three dimensions that now dominate total cost of ownership: cultural alignment, attrition, and IP jurisdiction. LATAM countries increasingly align with Western legal frameworks. Brazil’s LGPD mirrors GDPR principles, and the U.S. Chamber of Commerce’s IP Index ranks several Latin American jurisdictions materially higher than common offshore alternatives. Attrition rates, cultural friction costs, legal exposure, and async productivity drag all belong in the comparison matrix. For a fuller breakdown of the upside, see the benefits of nearshore outsourcing.
How Much Does Nearshore vs Offshore Cost Per Hour by Role and Region?
Nearshore LATAM rates run $55 to $100 per hour for senior backend engineers versus $40 to $65 offshore, but the rate card hides the costs that decide total spend. The tables below show published rates first, then the loaded cost that follows.
What Are the Rate Card Numbers by Role and Region for 2025 to 2026?
All figures are USD per hour, based on 2024 to 2025 data from Deel, Accelerance, Robert Half, and GEP for contract-based engagements through a staffing partner.
| Role | US Domestic | Colombia | Mexico | Argentina | India | Philippines |
|---|---|---|---|---|---|---|
| Senior Backend (7+ yrs) | $150–$220 | $60–$85 | $65–$90 | $55–$80 | $45–$65 | $40–$60 |
| Mid-Level Backend (3–5 yrs) | $100–$150 | $45–$65 | $50–$70 | $40–$60 | $30–$50 | $25–$45 |
| DevOps / Platform | $140–$200 | $55–$80 | $60–$85 | $50–$75 | $40–$60 | $35–$55 |
| QA / SDET | $80–$130 | $35–$55 | $40–$60 | $30–$50 | $25–$40 | $20–$35 |
| Engineering Manager | $160–$240 | $70–$95 | $75–$100 | $60–$85 | $50–$70 | $45–$65 |
AI/ML, Rust, and Go specializations command a 15 to 20% premium across every region (Deel 2024).
Why Do Published Rates Lie About Loaded Cost?
Published rates understate true cost because attrition, replacement, and management overhead never appear on a pricing slide. The loaded formula tells the real story.
Loaded Annual Cost = (Hourly Rate × Annual Hours) + (Replacement Cost × Attrition Probability) + (Management Overhead Hours × Internal Eng-Manager Rate)
Three variables drive the gap between rate-card savings and actual spend.
Attrition rate. India’s IT services sector runs 20 to 30% annual attrition (NASSCOM 2024 Strategic Review). LATAM nearshore partners operating dedicated team models report 10 to 15%, with top-quartile firms holding single digits (Nearshore Americas, 2023).
Replacement cost. SHRM estimates 1.5x to 2.0x annual salary per replacement, factoring recruitment, onboarding, and the 3 to 6 month ramp-up productivity loss.
Management overhead. Everest Group’s 2024 analysis found US engineering managers spend 6 to 10 additional hours per week coordinating with offshore teams versus nearshore teams. At $120 per hour fully loaded, that adds $37,440 to $62,400 per year per team.
Here is the worked example for a 10-person senior backend team over 12 months.
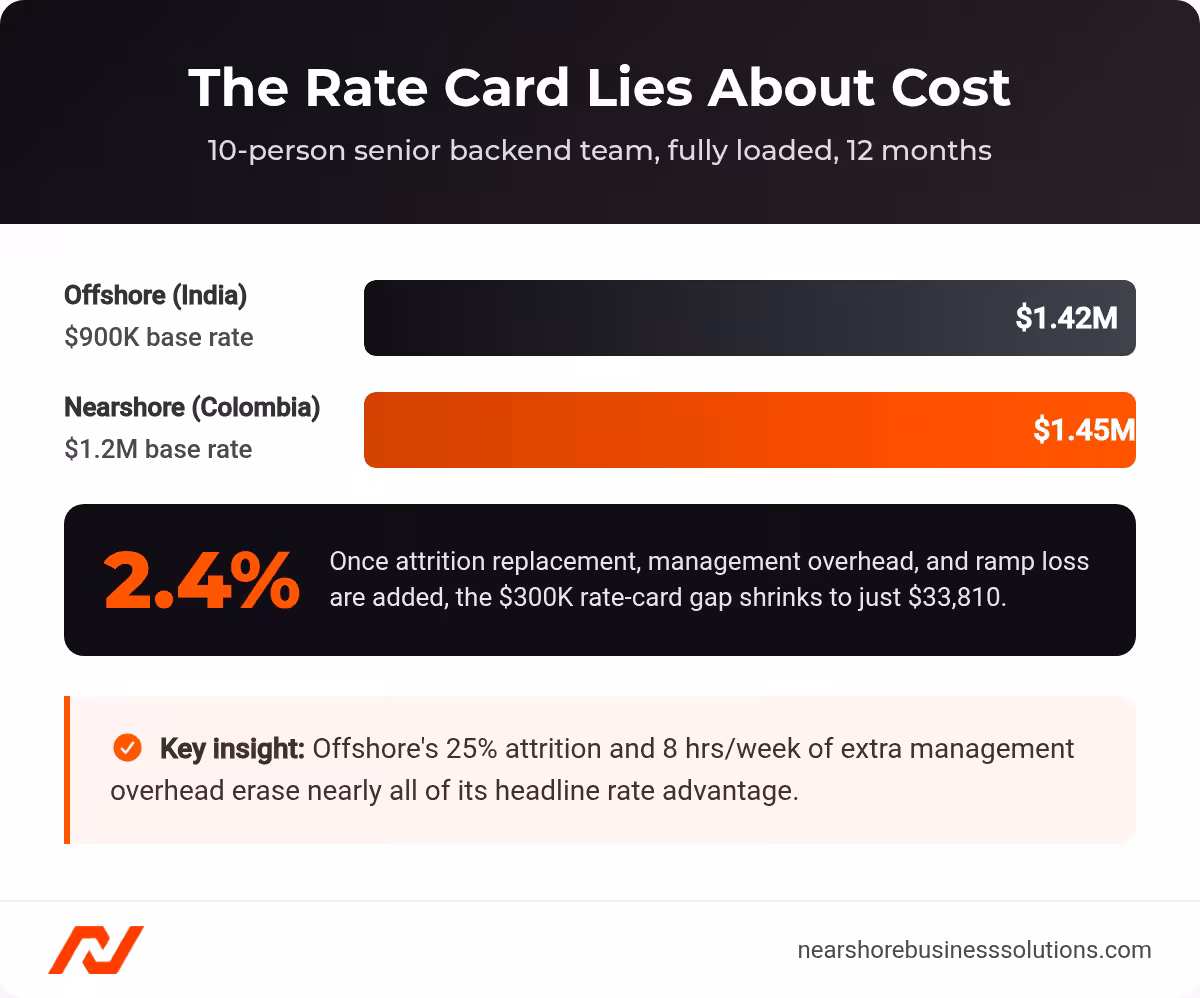
Fully loaded offshore vs nearshore cost for a 10-person senior backend team over 12 months.
| Cost Component | Offshore (India) | Nearshore (Colombia) |
|---|---|---|
| Base annual cost | $900,000 | $1,200,000 |
| Attrition replacement | $393,750 (25% rate) | $216,000 (12% rate) |
| Management overhead | $49,920 (8 hrs/wk) | $12,480 (2 hrs/wk) |
| Ramp productivity loss | $75,000 | $24,000 |
| Total loaded cost | $1,418,670 | $1,452,480 |
The $300,000 base-cost advantage shrinks to $33,810, a 2.4% difference. This model is conservative. It does not price the sprint-velocity drag from partially productive replacement engineers shipping code into an unfamiliar codebase.
When Does Offshore Still Win on Cost for High-Volume QA and Support Ops?
Offshore wins on cost when work is high volume, low ambiguity, and process-driven. A 50-person QA operation saves $312,000 to $520,000 annually on base cost in the Philippines versus Colombia. Attrition matters less because onboarding a manual QA tester takes weeks, not months, so the replacement cost multiplier drops from 1.5 to 2.0x down to roughly 0.5x. The Philippines’ mature BPO infrastructure delivers trained support agents at scale with established frameworks (CMMI, ISO 20000).
The decision boundary is simple. If the role requires daily synchronous collaboration with your US engineering team, the async penalty erodes offshore’s cost advantage to noise. If it executes against a spec with minimal real-time interaction, offshore delivers genuine savings.
How Does Time Zone Overlap Change Engineering Velocity in Nearshore vs Offshore Teams?
Time zone overlap of four or more hours raises on-time delivery by 22% and protects sprint velocity. Gartner states it directly: “Agile development methods are severely challenged by time zone differences greater than five hours,” with sprint velocity degradation of 15 to 30% in highly distributed teams. Pentalog’s analysis found teams with 4+ hours of overlap achieved a 22% higher on-time delivery rate than teams with 1 hour or less.
Where Does Async Collaboration Break Down at the 4-Hour Overlap Threshold?
Async collaboration breaks down below roughly four hours of overlap, where clarification delays compound into lost days. Carmel and Agarwal’s study in IEEE Software measured the damage: a task that took a co-located team 10 days required 15 to 20 days for a team separated by 12 hours. Forrester Consulting’s 2023 analysis confirmed the pattern, with simple clarifications accumulating a minimum 24-hour delay in offshore configurations and complex issues adding 2 to 3 days. Nearshore Americas found that for every 10-day sprint, teams separated by 10+ hours lose one full development day to communication latency. Over six months, that compounds to a full month of lost development.
How Does LATAM-to-US Overlap Compare to India-to-US Overlap Across a Sprint Week?
LATAM cities deliver 3 to 8 overlapping hours with US teams, while India and the Philippines deliver zero with US Eastern. The table maps a typical sprint week.
| US Time Zone | Bogotá | Mexico City | Buenos Aires | São Paulo | Bangalore | Manila |
|---|---|---|---|---|---|---|
| US Eastern | 8 hours | 7–8 hours | 6 hours | 6 hours | 0 hours | 0 hours |
| US Central | 7 hours | 8 hours | 5 hours | 5 hours | 0 hours | 0 hours |
| US Pacific | 5 hours | 6 hours | 3 hours | 3 hours | 0 hours | 0 hours |
Every LATAM city clears the 4-hour threshold for US Eastern and Central teams. For context, Eastern Europe delivers only 3 overlapping hours with US Eastern and zero with US Pacific, functionally closer to offshore than nearshore for most US teams.
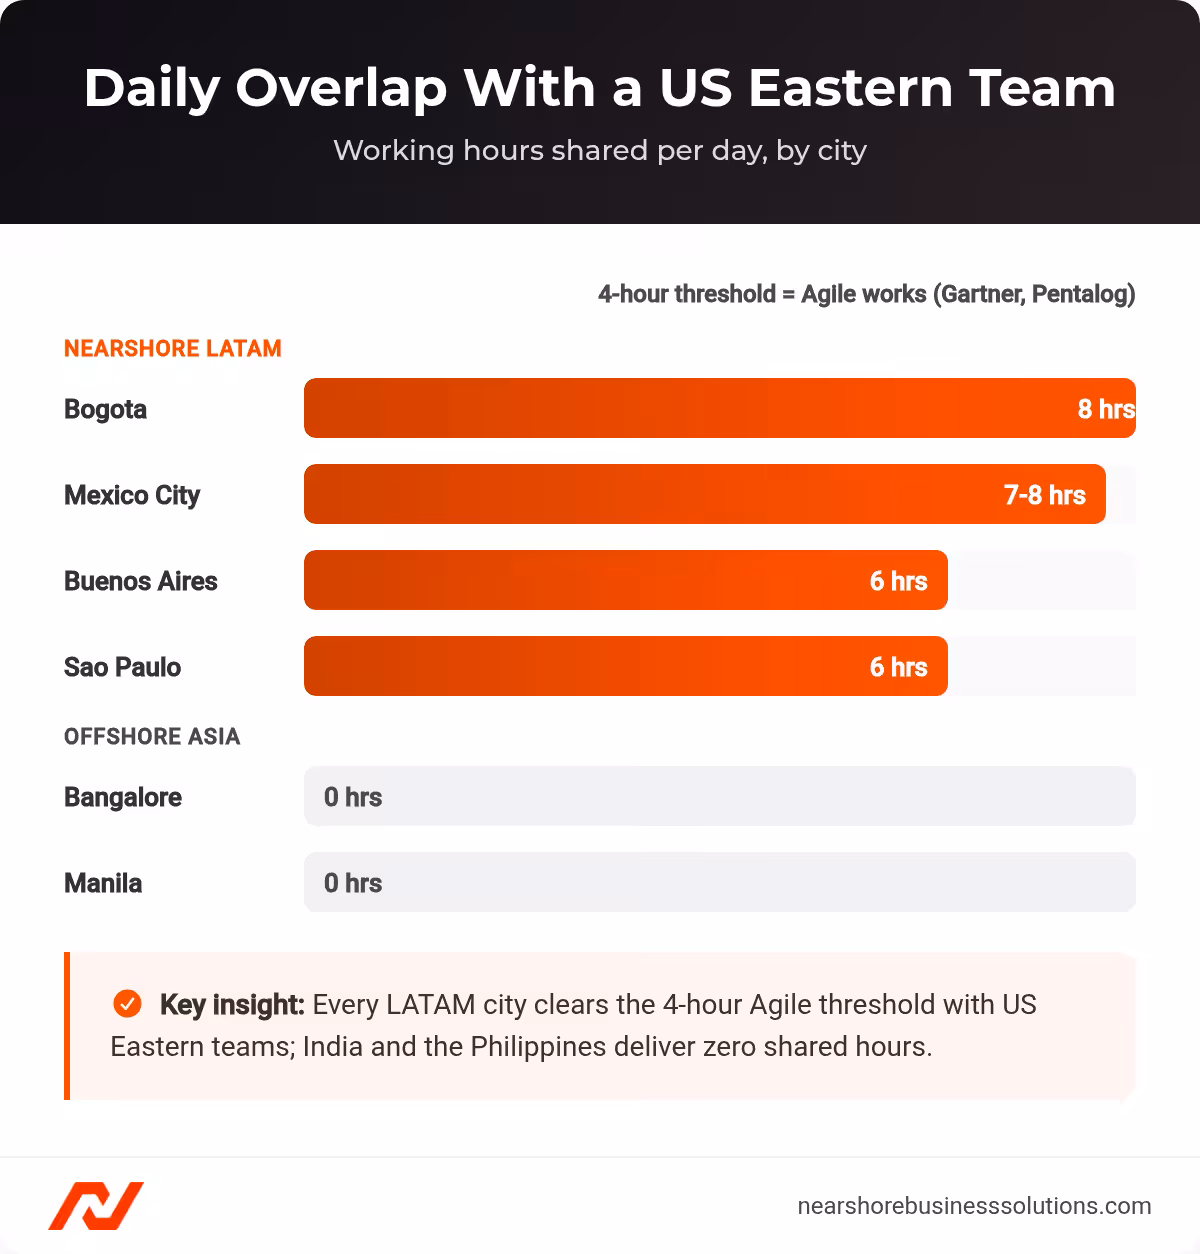
Daily working-hour overlap with US Eastern teams across nearshore LATAM and offshore Asia cities.
What Does Communication Overhead Cost Your Senior Engineers Each Year?
Communication overhead costs offshore-managed senior engineers $30,000 to $40,000 per year each in diverted time. Engineering managers with offshore teams spend 3 to 5 hours per week in meetings outside standard business hours (Nexus 2023 conference data, Nearshore Americas). Managers of nearshore teams report over 95% of meetings occur within their normal workday.
At a fully loaded US senior engineer rate of $150 to $200 per hour, four extra hours per week of async coordination costs $30,000 to $40,000 per year per senior engineer. That coordination covers handoff documents, Loom recordings, and Slack messages precise enough to survive a 12-hour interpretation gap. The cost lands on the client’s payroll as invisible throughput loss, with 10 to 12% of weekly capacity diverted from architecture, code reviews, and mentoring. With nearshore teams, the overhead drops to roughly one hour per week, recovering 150 to 200 hours per year of technical leadership capacity.
Is Nearshore or Offshore Better for Code Quality and Developer Retention?
Nearshore LATAM scores higher on both quality and retention, with 4.8/5.0 client satisfaction and 10 to 15% attrition versus offshore’s 20 to 30%. An analysis of over 5,000 client reviews on Clutch.co found Latin American development firms average 4.8/5.0 client satisfaction versus 4.6/5.0 for Indian firms, with LATAM firms disproportionately cited for proactive communication and tight team integration. Everest Group’s PEAK Matrix assessments consistently show clients rate nearshore providers higher on Relationship and Communication versus large-scale offshore providers.
Why Does Your Offshore Team Rebuild Itself Every 18 Months?
Offshore teams rebuild themselves because India and the Philippines run 20 to 30% annual attrition. India’s IT services sector churns through engineers at 20 to 30% annually (NASSCOM 2024). The Philippines IT-BPM sector runs 20 to 25% (IBPAP). LATAM nearshore firms operating dedicated team models report 10 to 15%, with top-quartile partners holding single digits. For context, the US domestic tech sector runs 13 to 18% (Radford/Aon Hewitt), which places LATAM’s best operators below the US baseline. Average tenure in LATAM nearshore dedicated teams runs 3 to 4 years, compared to 1.5 to 2 years in many Indian IT services firms (IAOP, 2023).
The compounding damage hits code quality directly. Tribal knowledge evaporates, because every departing engineer takes undocumented context about why systems behave the way they do. Architectural drift accelerates, because replacement engineers introduce competing patterns. Review rigor declines during ramp, because newcomers approve code they do not fully understand. A team with 10% attrition replaces one engineer per year. A team with 25% attrition replaces 2 to 3, creating a rolling onboarding burden that permanently taxes the stable core.
How Does Engineering Culture Fit Affect Pull Requests, Ownership, and Pushback?
Engineering culture fit determines whether developers challenge bad decisions or silently ship them, and LATAM scores closer to US norms on the cultural dimensions that drive pushback. The table compares the relevant indices.
| Attribute | US | Mexico | Colombia | Argentina | Brazil | India | Philippines |
|---|---|---|---|---|---|---|---|
| Power Distance Index | 40 | 81 | 67 | 49 | 69 | 77 | 94 |
| Individualism Index | 91 | 30 | 13 | 46 | 38 | 48 | 32 |
| Agile Adoption (>75%) | ~90% | ~85% | ~85% | ~85% | ~85% | ~70% | ~65% |
| EF English Rank | n/a | 89 | 75 | 28 | 70 | 60 | 20 |
Tech-sector English proficiency significantly exceeds national averages. Partner vetting, not national scores, determines engineer fluency.
Argentina’s Power Distance of 49 sits closest to the US baseline of 40. That means engineers are culturally predisposed to flat-hierarchy interaction: challenging design decisions, flagging scope creep, and pushing back on unrealistic commitments. AgileSherpas (2023) found 85% of LATAM firms run over 75% of projects on Agile versus roughly 70% for Indian firms. LATAM developers educated at institutions like ITESM, UBA, Universidad de los Andes, USP, and Unicamp internalize norms around code review ownership and production accountability that mirror US startup culture.
This is not about individual capability. Indian engineers in US domestic teams perform identically to peers. The pattern emerges from organizational norms within offshore delivery centers, where hierarchical structures and utilization-rate incentives discourage the friction that prevents defects.
How Does IP Protection and Legal Jurisdiction Compare Across Countries?
IP protection varies widely, and Mexico and Brazil rank materially stronger than India and Argentina. The table shows 2024 IP Index standings.
| Country | 2024 IP Index Rank | Score (% of max) |
|---|---|---|
| United States | 1 | 95.48% |
| Mexico | 23 | 55.42% |
| Brazil | 31 | 49.02% |
| Philippines | 33 | 47.33% |
| Colombia | 34 | 46.50% |
| India | 42 | 38.64% |
| Argentina | 45 | 36.98% |
Mexico and Brazil offer materially stronger IP protection frameworks than India and Argentina (U.S. Chamber of Commerce, 2024). Brazil’s LGPD aligns closely with Western data privacy standards. For US SaaS companies shipping proprietary code, jurisdiction matters the moment a contractor dispute reaches litigation.
How Should You Weight a Nearshore vs Offshore Decision Matrix?
You should weight the matrix by company stage and team size, because the right answer shifts as headcount and priorities change. A 15-engineer startup optimizing for speed and a 500-engineer enterprise optimizing for cost reach opposite conclusions from the same data.
How Do You Weight the Matrix for Your Company Stage and Team Size?
Weight the matrix against your stage using these three profiles.
- Early-stage startup, fewer than 20 engineers, speed-is-everything: nearshore wins. Maximum overlap accelerates iteration, and you cannot afford attrition-driven knowledge loss at this scale. HackerRank data shows Argentina and Brazil typically rank in the top 40 globally, often outperforming India and the Philippines in algorithm and data structure challenges.
- Enterprise, 500+ engineers, cost-optimization mandate: offshore may win for commodity roles. India produces 1.5M+ engineering graduates annually (UNESCO), and the pipeline supports high-volume, scale-out staffing. For process-driven QA and support, the cost arbitrage is real and the overlap penalty is manageable.
- Scale-up, 50 to 150 engineers, hybrid model: nearshore core plus offshore QA layer. Core product engineers nearshore in LATAM for velocity and retention. High-volume QA, data labeling, and L1 support go offshore for cost efficiency.
Why Do Most Scaling Teams Land on Nearshore for Core Product Engineering?
Most scaling teams land on nearshore because it captures 40 to 60% savings while preserving the overlap that protects velocity. For US companies weighing the move, those savings are only one of the top nearshore outsourcing advantages, alongside deeper talent access and real-time collaboration. Companies realize 40 to 60% cost reduction versus US domestic hiring with nearshore LATAM (Deel, 2024) while keeping 4 to 8 hours of daily overlap. The break-even math is straightforward. If one attrition replacement costs $135K to $180K (SHRM formula applied to a $90K offshore developer), and nearshore’s lower attrition prevents even one such replacement per year in a 10-person team, the savings exceed the rate premium.
LATAM’s talent pool supports the model at scale. Brazil fields 500K to 700K developers, Mexico 225K to 300K, Argentina 135K to 175K, and Colombia 100K to 150K (Statista, GitHub, Stack Overflow). AI/ML talent hubs are emerging in São Paulo, Medellín, and Guadalajara (Revelo, 2024). The ecosystem is not just cheaper than domestic. It is maturing into a durable engineering partner market, a pattern detailed in our guide to hiring software developers in Latin America.
Should a VP of Engineering Choose Nearshore or Offshore in 2026?
You should choose nearshore LATAM for core product engineering in 2026 if your priority is shipping velocity, team stability, and real-time collaboration. The data converges: 40 to 60% cost savings versus domestic, 4 to 8 hours daily overlap, 4.8/5.0 client satisfaction, and 10 to 15% attrition versus 20 to 30% offshore.
What Is the 80/20 Play for Nearshore Core and Offshore Scale-Out?
The 80/20 play puts core product engineers nearshore and scale-out operations offshore. Core product engineers (backend, frontend, platform, SRE) go nearshore in LATAM for velocity and retention. High-volume QA, data labeling, and L1 support go offshore in India and the Philippines for cost efficiency. This captures the economics of both models without forcing either into a context where it underperforms. A staff augmentation engagement is the fastest way to stand up the nearshore half of that split.
What Three Due-Diligence Questions Should You Ask Before You Sign?
Ask these three questions before signing any contract.
- What is the provider’s 12-month attrition rate for engineers at my seniority level? Major Indian firms report 15 to 20% quarterly attrition. Leading LATAM partners report single-digit annual rates for dedicated teams. Ask for auditable data, not averages.
- How many overlapping working hours will my team actually get? The 4-hour threshold is the minimum for effective Agile collaboration (Gartner, Pentalog). Verify actual working hours, not just time zone math.
- In which jurisdiction are IP assignments enforceable? IP Index scores range from 36.98% (Argentina) to 55.42% (Mexico). Ask where disputes would be adjudicated and whether assignments are governed by local or US law.
Frequently Asked Questions About Nearshore vs Offshore
What is the main difference between nearshore and offshore outsourcing?
Nearshore means teams within 1 to 3 time zones of your headquarters, which for US companies is Latin America. Offshore means teams 8 to 12 time zones away, typically India or the Philippines. The practical difference is six to eight hours of daily overlap nearshore versus zero with US Eastern offshore.
Is nearshore really cheaper than offshore once you include all costs?
Offshore rate cards look cheaper, but loaded cost narrows the gap sharply. In a 10-person senior backend team, India’s $300,000 base-cost advantage shrinks to about $33,810 (a 2.4% difference) once you add attrition replacement, management overhead, and ramp productivity loss.
How many hours of overlap do you need for Agile to work?
You need at least four overlapping hours. Gartner reports sprint velocity degrades 15 to 30% past a five-hour gap, and Pentalog found teams with 4+ hours of overlap hit a 22% higher on-time delivery rate. Every major LATAM city clears that threshold for US Eastern and Central teams.
Which option is better for protecting intellectual property?
Mexico and Brazil rank materially higher on the 2024 IP Index (55.42% and 49.02%) than India (38.64%) or Argentina (36.98%). Brazil’s LGPD also aligns with Western data privacy standards, which lowers legal exposure for US SaaS companies.
When does offshore still make sense?
Offshore makes sense for high-volume, low-ambiguity, process-driven work such as manual QA, data labeling, and L1 support. A 50-person QA operation can save $312,000 to $520,000 annually in the Philippines versus Colombia, and the async penalty is manageable when the role needs little real-time collaboration.
Can you combine nearshore and offshore?
Yes. The hybrid 80/20 play puts core product engineers nearshore in LATAM for velocity and retention, and high-volume QA and support offshore for cost efficiency. This captures the economics of both models without forcing either into a context where it underperforms.
Ready to Build Your Nearshore Engineering Team?
Nearshore Business Solutions sources and vets developers across LATAM hubs in Mexico City, Bogotá, Medellín, São Paulo, and Buenos Aires. We screen for technical skills, English fluency, and US work style fit.
No long-term contract is required to start. A 2 to 4 engineer nearshore pilot, matched in under 14 days with full overlap to US time zones, gives you the data to make the build-versus-buy decision with confidence.
Design your nearshore pilot and receive a custom team plan and quote.