
Chile, Peru, and Uruguay offer US tech companies 60-68% cost savings versus fully loaded US rates, with engineers operating in the same or adjacent time zones.
Senior engineers in these markets cost $61,000-$115,200 per year. A 10-person product team nearshored to Chile or Uruguay runs approximately $525,000 annually versus $1.27 million in the US. Peru brings that number even lower, with savings exceeding $800,000 per year.
We connect you with vetted engineers from Santiago, Lima, and Montevideo. Each candidate is screened for technical skills, English fluency, and US work style fit. Below, you’ll find salary benchmarks by role, regulatory comparisons, startup ecosystem data, and a market selection framework for your specific team type.
What Makes Chile, Peru, and Uruguay Different from Tier-1 LATAM Markets?
Tier-2 LATAM markets win on precision, not headcount. Brazil and Mexico offer larger developer pools, but come with proportionally higher management overhead, greater legal complexity, and less predictable talent retention. Chile, Peru, and Uruguay are not competing on raw volume. They deliver higher seniority density, sharper technical specialization, and stronger regulatory frameworks for growth-stage US tech firms.
For more context on hiring developers across Latin America, see our full regional guide.
What Is the Core Value Proposition of Tier-2 LATAM Markets?
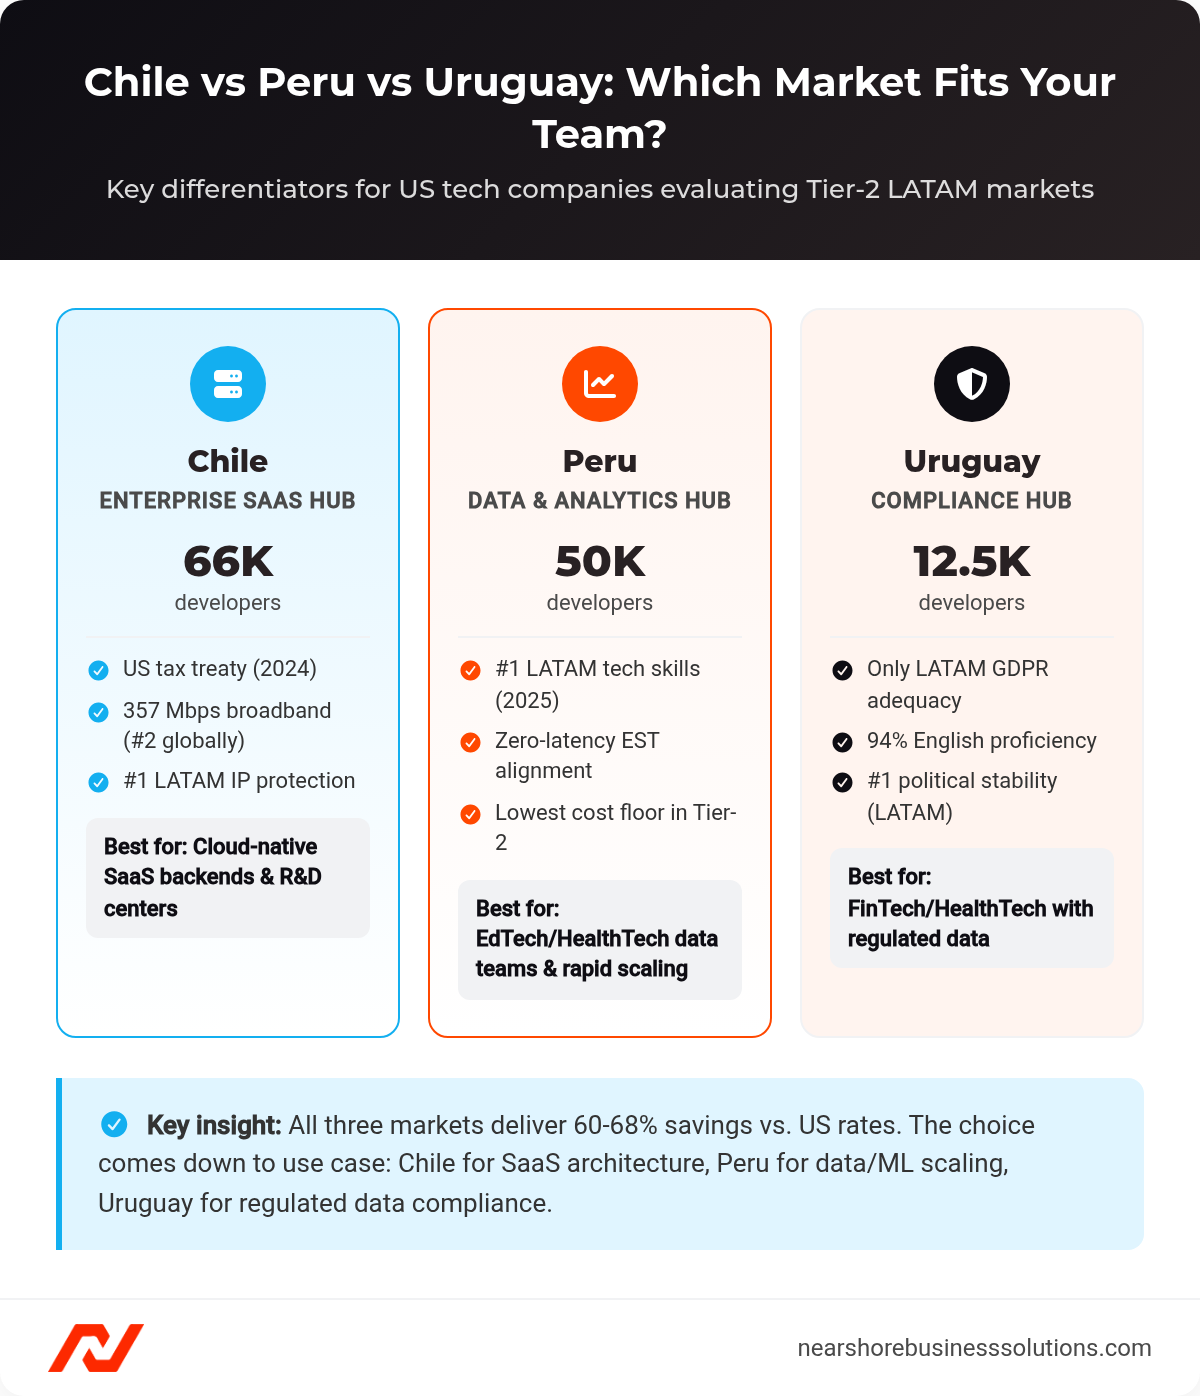
Three markets, three distinct technical identities. Chile delivers enterprise maturity, infrastructure, and legal alignment with the US. Peru offers analytical depth, upskilling velocity, and the lowest cost floor. Uruguay provides compliance-grade precision, GDPR adequacy, and boutique QA expertise. Each market is a specialized hub built for embedded product squads, not ticket-queue outsourcing.
How Do Time Zones Compare Across These Three Markets?
All three markets deliver 6-8 hours of overlap with US Eastern Time. Peru aligns perfectly with EST for most of the year, giving it “zero-latency” synchronization with East Coast teams. Chile and Uruguay run 1-2 hours ahead of ET, giving 8 and 6-7 hours of overlap respectively. West Coast teams get 4-5 hours of morning overlap with Chile and Peru. That’s enough for daily standups, live code reviews, and real-time incident response without the handoff delays of offshore models.
| Country | ET Overlap | PT Overlap | Collaboration Model |
|---|---|---|---|
| Peru | 8 hours | 5 hours | Real-time / Pair programming |
| Chile | 8 hours | 4-5 hours | Synchronous / Agile |
| Uruguay | 6-7 hours | 3-4 hours | Hybrid / Synchronous |
What Makes Chile the Top Tier-2 Tech Market for Enterprise SaaS?
Chile is the most US-aligned tech market in the region. It holds an active bilateral tax treaty with the US, a senior developer density built for complex cloud architecture, and the #1 ranking in LATAM for ease of doing business. For hiring developers in Chile, the legal and tax infrastructure is the most mature in Tier-2.
How Large Is Chile’s Developer Pool and Tech Sector?
Chile’s developer pool sits at approximately 66,000, with 120,000 total tech professionals in Santiago. The market ranks 1st in LATAM for ease of doing business and has earned the “Chilecon Valley” designation for startup culture depth. It specializes in enterprise SaaS, FinTech infrastructure, and DevOps. Microsoft built its first LATAM cloud region in Chile. Google routed trans-Pacific subsea cables through the country. Both signal long-term infrastructure commitment.
What Does Chile’s Talent Pipeline Look Like?
Chile graduates over 60,000 software engineers and technical professionals annually, with 25% of all university graduates in STEM. Top institutions include the University of Chile and Pontificia Universidad Católica. Core skills concentrate in React, Node.js, and Java. AI upskilling has accelerated sharply: specialized AI course enrollments grew 334% year-over-year into 2025. English proficiency ranks 9th in LATAM on the EF EPI.
What Are Chile’s Regulatory and Tax Advantages?
The US-Chile Income Tax Treaty took effect January 1, 2024. Ruling No. 1611/2025 confirmed that software license and reseller payments qualify as “business profits,” exempt from Chilean withholding tax. For US SaaS firms establishing regional R&D centers, this eliminates significant cross-border payment friction. Chile ranks 2nd in LATAM for corruption perception (32nd globally) and holds the top regional IP protection ranking per IPRI 2025.
What Are the Key Facts About Chile as a Tech Market?
| Factor | Detail |
|---|---|
| Top advantage | Active US tax treaty; 2nd globally for fixed broadband (357 Mbps) |
| Talent cost | Senior engineers: $63,000-$115,200/year |
| Risk flag | Political Stability Score: 0.12 (moderate; pension and social reforms ongoing) |
| Best for | Complex cloud-native backends, SaaS infrastructure, regional R&D centers |
What Makes Peru the Fastest-Upskilling Tier-2 Tech Market?
Peru ranked #1 in Latin America for technology skills in 2025, with its deepest concentration in data science and analytical modeling. It’s the cost-competitive pick for companies scaling data-heavy teams fast. Hiring developers in Peru delivers the lowest cost floor of the three markets and perfect East Coast time zone alignment.
How Large Is Peru’s Developer Pool and Tech Sector?
Peru’s engineering workforce has reached approximately 50,000 professionals. The domestic tech industry is projected to hit $16.89 billion in valuation by 2027. Peru’s lead is in capability, not just headcount: the #1 LATAM tech skills ranking specifically covers data science and analytical modeling. IBM and Microsoft maintain major engineering sites in Lima, focused on cloud services and enterprise support.
What Does Peru’s Talent Pipeline Look Like?
Peru produces 20,000+ tech graduates annually, with 30% of all university graduates in STEM. That’s the highest STEM share of the three markets. Core specializations include Python, JavaScript/TypeScript, and data-intensive backend architecture. The government’s Innova Peru initiative has modernized CS curricula, ensuring the latest graduates are fluent in modern full-stack stacks and AI integration. English proficiency is still rising (EF EPI: “Rising”), which is a live constraint for direct US client-facing roles.
What Are Peru’s Regulatory Conditions and Business Risks?
Peru has no active US tax treaty and no GDPR adequacy designation. Data privacy frameworks are still developing. The Corruption Perceptions Index places Peru at 121st globally. Political Stability Score is -0.65, the most volatile of the three. IP protection ranks 75th globally per IPRI 2025. Labor law requires careful management of “Gratificacion,” mandatory bonus payments that add to employer cost. The private sector has historically operated independently of political volatility, but expect more legal overhead than Chile or Uruguay.
What Are the Key Facts About Peru as a Tech Market?
| Factor | Detail |
|---|---|
| Top advantage | EST zero-latency alignment; #1 LATAM tech skills ranking; lowest cost floor |
| Talent cost | Junior: from $11,880/year; Senior: $61,265-$72,000/year |
| Risk flag | Political Stability Score: -0.65; no US tax treaty; data privacy developing |
| Best for | Data-intensive EdTech/HealthTech, rapid team scaling, East Coast-synced product squads |
What Makes Uruguay the Compliance Hub for FinTech and HealthTech?
Uruguay is the only Latin American country with an EU GDPR Adequacy Decision, the #1 IP protection ranking in LATAM, and 94% English proficiency among engineers. Four of those facts are unique to Uruguay in the entire region. For hiring developers in Uruguay, the compliance advantage is structural, not incremental.
How Large Is Uruguay’s Developer Pool and Tech Sector?
Uruguay’s developer pool is approximately 12,500. Small by design, not by accident. The country of 3.4 million produces 5,000 tech graduates annually, with the workforce oriented toward export to the US market. Montevideo is recognized as the world’s second-fastest-growing city for FinTech by the European Center for Digital Competitiveness. dLocal, Uruguay’s flagship tech exit, reached a $9 billion valuation at IPO.
What Does Uruguay’s Talent Pipeline Look Like?
94% English proficiency among software engineers is the highest of the three markets and a direct operational advantage for embedded US teams. Uruguay is the regional leader in Software Quality Assurance and test engineering. That QA density makes it a preferred partner for mission-critical SaaS. The 98.7% national literacy rate and a curriculum prioritizing STEM and digital ethics underpin a workforce that adapts well to compliance-heavy environments. EF EPI English rank: 3rd in LATAM.
What Are Uruguay’s Regulatory Advantages for Data-Sensitive Work?
Uruguay is the only Latin American country with an EU GDPR Adequacy Decision under Law No. 18.331. Personal data flows between the EU and Uruguay without additional legal safeguards. That pre-cleared path eliminates significant legal overhead for HealthTech and FinTech firms with European operations. IPRI 2025 places Uruguay 1st in Latin America for property rights protection (26th globally). Corruption Perceptions Index: 16th globally, ahead of many Western European countries, and 1st in South America. Political Stability Score: 1.28, the highest of the three. Zonamerica, the country’s flagship business park, offers tax-free status for service exporters.
What Are the Key Facts About Uruguay as a Tech Market?
| Factor | Detail |
|---|---|
| Top advantage | Only LATAM country with GDPR adequacy; #1 LATAM IP protection; 94% English proficiency |
| Talent cost | Senior engineers: $61,732-$115,200/year; QA/QE leads: $35,000-$80,000/year |
| Risk flag | Smallest pool (12,500 developers); no US tax treaty; 5,000 graduates/year limits rapid scaling |
| Best for | FinTech/HealthTech with regulated data, high-stakes QA, compliance-critical SaaS |
How Do Chile, Peru, and Uruguay Compare Across Key Indicators?
Side-by-side, these three markets split cleanly across six dimensions. All three deliver 60-68% cost savings versus fully loaded US rates. The differences are in regulatory posture, talent depth, and infrastructure quality.
How Do Salary Ranges Compare Across All Three Markets?
LATAM Tier-2 developers cost $11,880 to $115,200 annually, versus $85,000 to $210,000 for equivalent US roles. The savings percentage consistently lands between 60-68% for generalist engineering roles. Specialized AI engineers in Chile or Uruguay earn $110,400-$165,600 in total annual compensation. The equivalent in Silicon Valley or New York exceeds $250,000.
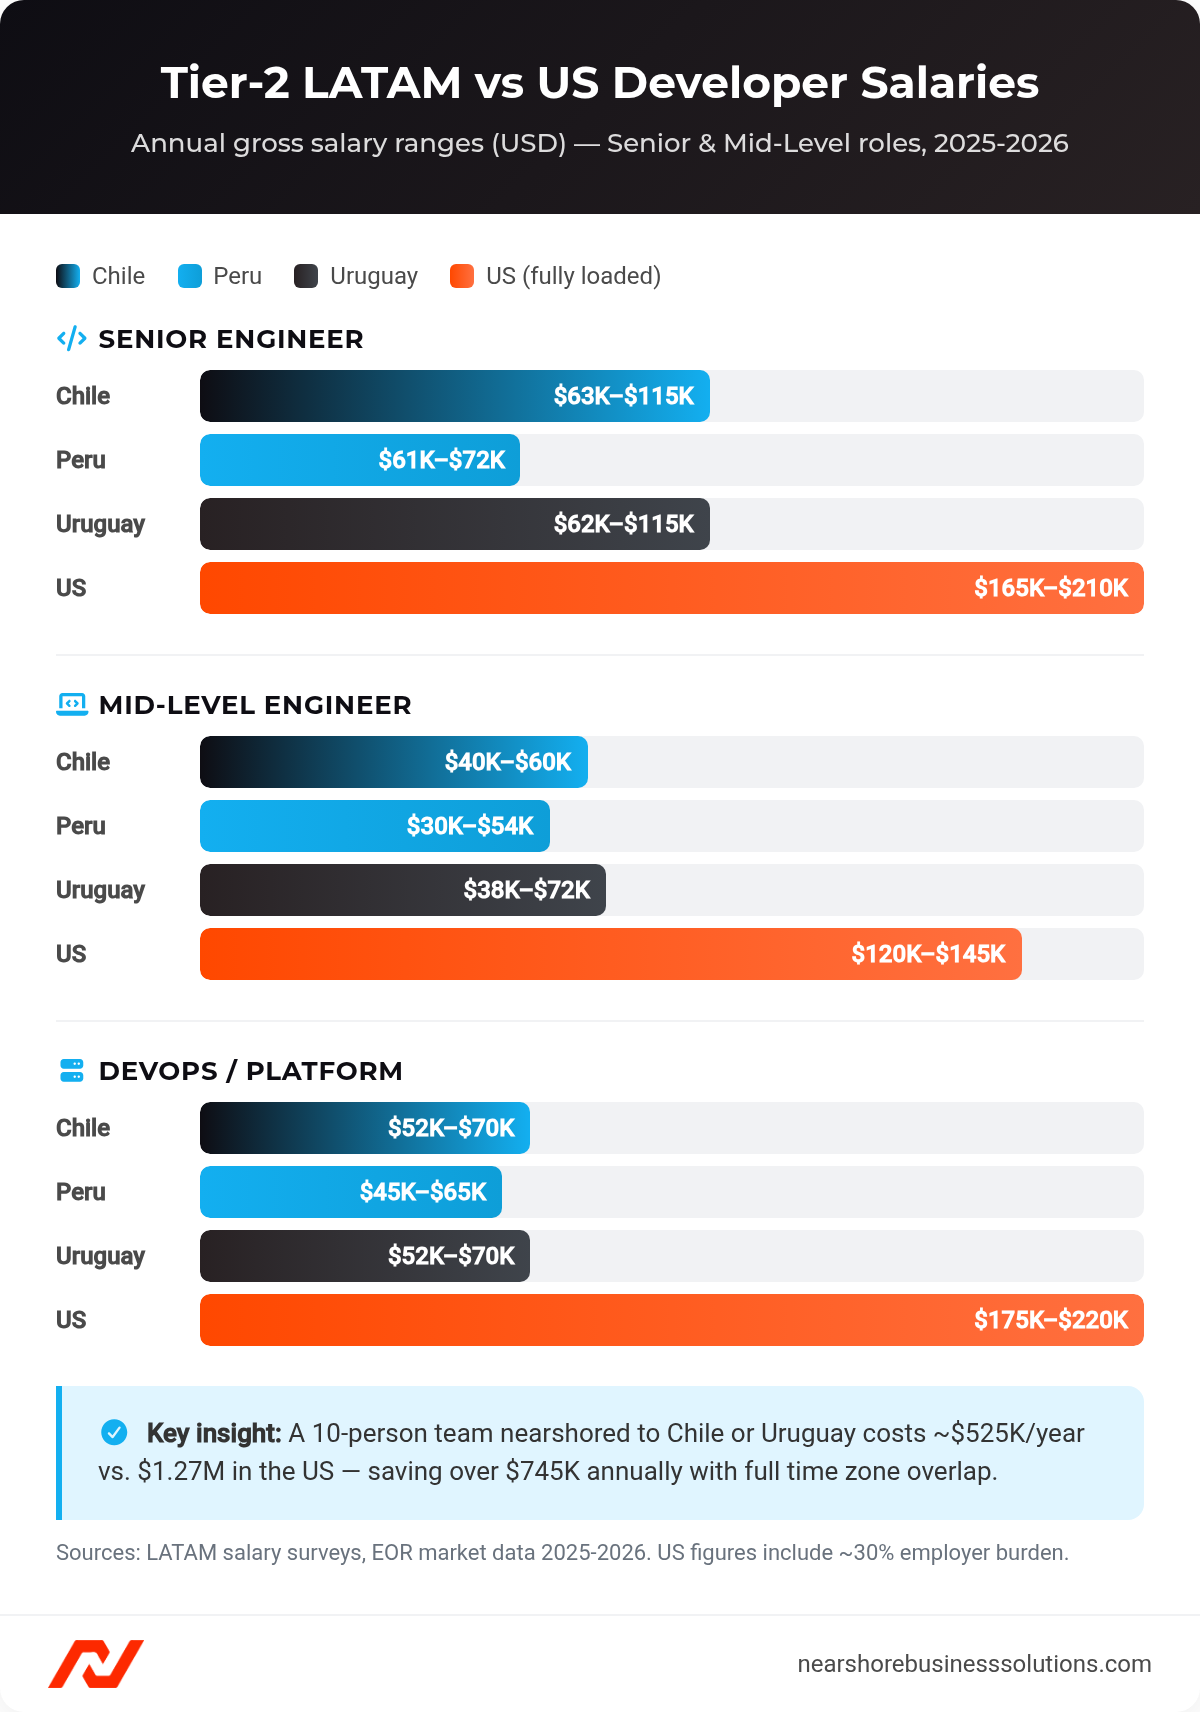
Annual developer salary ranges across Chile, Peru, and Uruguay versus fully loaded US costs by role.
| Role | Chile | Peru | Uruguay | US (Fully Loaded) |
|---|---|---|---|---|
| Junior Engineer | $17,400-$28,000 | $11,880-$25,000 | $18,000-$37,950 | $85,000-$105,000 |
| Mid-Level Engineer | $40,000-$60,000 | $30,000-$54,000 | $37,950-$72,000 | $120,000-$145,000 |
| Senior Engineer | $63,000-$115,200 | $61,265-$72,000 | $61,732-$115,200 | $165,000-$210,000 |
| DevOps / Platform | $52,310-$70,000 | $45,000-$65,000 | $52,300-$70,000 | $175,000-$220,000 |
| QA / QE Lead | $45,000-$60,000 | $26,000-$35,000 | $35,000-$80,000 | $140,000-$165,000 |
| Product Manager | $45,000-$80,000 | $40,000-$65,000 | $45,000-$80,000 | $150,000-$190,000 |
A 10-person product team (3 senior, 5 mid, 2 junior) costs approximately $1.27 million annually in the US. Nearshored to Chile or Uruguay: approximately $525,000. Peru runs even lower. Annual savings can exceed $800,000 for the same team composition.
How Do Startup Ecosystems Compare Across the Three Markets?
Chile has the deepest incubation infrastructure: Start-Up Chile has run for 15 years, incubated 2,000+ companies from 85 countries, and produced unicorns including NotCo, Betterfly, and Kavak. Uruguay’s headline exit is dLocal, which reached a $9 billion valuation at IPO. Microsoft operates one of its few global AI Co-Innovation Labs in Montevideo. Peru reached $100 million in VC investment in 2022, with IBM and Microsoft running major engineering sites in Lima.
| Market | Tech Professionals | Incubator | Flagship Exit |
|---|---|---|---|
| Santiago, Chile | 120,000 | Start-Up Chile (2,000+ companies, 85 countries) | NotCo, Betterfly, Kavak |
| Lima, Peru | 50,000 | Innova Peru | Culqi (near-unicorn) |
| Montevideo, Uruguay | 12,500 | Newlab Montevideo | dLocal ($9B IPO) |
How Does Infrastructure and Connectivity Compare?
Chile’s broadband ranking (2nd globally at 357 Mbps, behind only Singapore) is a material advantage for distributed teams running high-bandwidth workflows. Uruguay maintains elite infrastructure: 90% internet penetration and a government-backed 5G rollout through Antel. Peru’s 70% penetration rate creates risk for team members outside Lima’s Miraflores and San Isidro corridors.
| Metric | Chile | Peru | Uruguay |
|---|---|---|---|
| Median Fixed Broadband | 357 Mbps | 252 Mbps | 193 Mbps |
| Global Speed Rank | 2nd | 18th | 36th |
| Internet Penetration | 90% | 70% | 90% |
| Primary Tech Hub | Costanera Center | San Isidro / Miraflores | Zonamerica |
How Do Legal and Compliance Frameworks Compare?
Uruguay holds the only GDPR adequacy decision in the region. Chile holds the only active US tax treaty. Peru is still developing both.
| Metric | Chile | Peru | Uruguay |
|---|---|---|---|
| Ease of Doing Business | 1st in LATAM | Emerging | Stable |
| Data Privacy | Aligning with GDPR | Developing | GDPR Adequate |
| IP Protection (Global) | 1st in LATAM (WIPO) | 75th | 26th |
| US Tax Treaty | Yes (Jan 2024) | No | No |
| Corruption Perception | 32nd globally | 121st globally | 16th globally |
| Political Stability Score | 0.12 | -0.65 | 1.28 |
What Are the Main Risks Across These Three Tech Markets?
No market is risk-free. Three structural risks stand out across the Tier-2 group: political volatility, talent pool constraints, and infrastructure gaps.
What Are the Political and Economic Stability Risks?
Uruguay presents the lowest sovereign risk of the three, ranking 16th globally on Transparency International’s Corruption Perceptions Index. Chile’s reforms are ongoing, but its Central Bank and Judicial System remain independent and robust. Political Stability Score: 0.12. Peru’s political risk is real, with a -0.65 stability score. Its technocratic institutions and private sector have historically operated independently of executive instability, and inflation remains low relative to regional averages.
What Are the Talent Retention and Scaling Risks?
Uruguay’s small pool is its binding constraint. With 12,500 developers and only 5,000 graduates annually, rapid headcount scaling is structurally limited. Plan for a boutique model. Peru’s English proficiency gap (EF EPI “Rising”) is a live risk for direct US client-facing roles. Chile’s “Tier-2 Premium” is a subtler risk: senior engineer salaries reaching $115,200 compress the cost advantage at the top of the salary band. Budget for this if the team is senior-heavy.
What Are the Infrastructure Risks?
Peru’s 70% internet penetration is the most significant infrastructure risk. Teams outside Lima’s Miraflores and San Isidro corridors may face inconsistent connectivity. Uruguay’s Antel state-owned telecom prioritizes long-term network stability over competitive speed: 193 Mbps median (36th globally). Reliable, but behind Chile’s world-class 357 Mbps. For high-bandwidth engineering workflows, Chile’s infrastructure is in a different tier.
Which Hiring Model Works Best for These Markets?
The Employer of Record (EOR) model is the standard vehicle for US growth-stage companies that haven’t incorporated a local entity. All three markets fully support it.
What Is the Difference Between Contractor and EOR Models?
Two models dominate nearshore hiring. The contractor model costs approximately $6,000 per month for a senior role but exposes the US firm to misclassification audits and IP assignment risks. The EOR model runs $6,300-$7,200 per month for a mid-level engineer, covers statutory benefits (pension, healthcare, severance), and assigns IP to the US entity. For most growth-stage companies, EOR is the lower-risk path.
| Hiring Model | Cost (Mid-Level) | Risk Profile |
|---|---|---|
| Contractor | ~$6,000/month | IP assignment risk; misclassification exposure |
| EOR | $6,300-$7,200/month | Full statutory compliance; IP assigned to US entity |
How Do Labor Law Requirements Differ Across the Three Countries?
Chile has a stable labor framework with social security contributions approximately 30% above base salary. Peru requires careful management of “Gratificacion,” mandatory bonus payments that add to employer cost. Uruguay’s labor laws are highly supportive of the tech sector, with specific tax exemptions for software exports that reduce costs for US-facing dev shops operating from Zonamerica.
Frequently Asked Questions About Tier-2 LATAM Tech Markets
These are the most common questions US tech leaders ask when evaluating Chile, Peru, and Uruguay.
How Long Does It Take to Hire Developers in These Markets?
Through an EOR or staffing partner, you receive pre-vetted candidates in 2-4 weeks. Direct hiring without a local entity takes 4-8 weeks, depending on the country’s labor framework. Chile and Uruguay have the most streamlined onboarding processes.
What If a Developer Does Not Work Out?
Most reputable nearshore partners offer a 90-day replacement guarantee. If a hire does not meet expectations within the first three months, the partner replaces the developer at no additional cost. This is standard practice for EOR-based engagements.
Do I Need to Provide Equipment?
In most EOR arrangements, the employer of record handles equipment procurement and provisioning. You define the specs. The EOR sources, purchases, and ships devices to the developer. Some firms offer a bring-your-own-device policy for senior engineers.
How Do I Pay Developers in These Markets?
Through an EOR, you pay a single monthly invoice in USD to the EOR provider. The provider handles local payroll, statutory benefits, and currency conversion. Direct contractor payments can go via wire transfer or platforms like Deel or Rippling.
Do I Need a Local Entity to Hire in Chile, Peru, or Uruguay?
No. The EOR model eliminates the need to incorporate a legal entity in each country. The EOR becomes the legal employer in the local jurisdiction. You maintain full day-to-day control over the developer’s work.
What Is the Difference Between Nearshore and Offshore?
Nearshore refers to hiring in countries within 1-3 time zones of your headquarters. Offshore typically means 8-12 time zone differences. Nearshore enables real-time collaboration: daily standups, live code reviews, and same-day incident response. Offshore requires asynchronous workflows with handoff delays of 12-24 hours.
Which Market Is Best for FinTech with European Data Requirements?
Uruguay is the only option with pre-cleared EU data transfer status. Its GDPR Adequacy Decision under Law No. 18.331 means personal data flows between EU and Uruguay without additional legal agreements. No other country in Latin America has this designation.
Which Tier-2 LATAM Market Should You Choose?
The right market depends on what you are scaling: team size, technical specialty, or regulatory posture. Three markets, three clear use cases.
Chile, Peru, and Uruguay compared by developer pool size, top advantages, and ideal team type.
| If you need… | Choose… | Key reason |
|---|---|---|
| Complex cloud-native SaaS backend | Chile | US tax treaty, 357 Mbps broadband, mature DevOps talent |
| Data-intensive analytics / ML team | Peru | #1 LATAM tech skills, EST zero-latency, most cost-competitive |
| FinTech / HealthTech with regulated data | Uruguay | GDPR adequate, #1 LATAM IP protection, 94% English proficiency |
Across all three, the operational fundamentals are consistent: 60-68% cost reduction versus US fully loaded rates, synchronous collaboration windows sufficient for Agile at full velocity, and EOR availability that removes the need to incorporate a local entity. The Tier-2 LATAM model replaces ticket-queue outsourcing with embedded engineering teams that operate, collaborate, and ship like in-house staff.
Ready to Build Your LATAM Engineering Team?
Nearshore Business Solutions sources and vets developers from Santiago, Lima, and Montevideo. We screen for technical skills, English fluency, and US work style fit. Our acceptance rate is 16%.
Every placement includes a 90-day replacement guarantee. You receive pre-vetted candidates in 2-4 weeks.
Get a free consultation to discuss your hiring needs and receive a custom quote.