
Staff augmentation costs $45-$175/hr depending on region and seniority, per 2023 global software outsourcing rate benchmarks. LATAM nearshore rates run $45-$140/hr, saving 40-60% versus US domestic augmentation at $85-$250/hr (Grand View Research, 2023). This guide breaks down every cost layer in the bill rate, so you can negotiate from data rather than guesswork.
LATAM staff augmentation delivers senior developers at $80-$110/hr versus $150-$200+ onshore. On a five-person senior team working 2,000 hours per year, that saves $700,000-$900,000 annually. Vendors across Colombia, Mexico, Brazil, and Argentina supply 2.5+ million developers with 250,000+ new STEM graduates entering the market each year (Stack Overflow Developer Survey 2023; GitHub Octoverse Report 2023). Companies that underestimate the hidden costs of not going nearshore routinely overspend by 40-60% on talent that delivers identical output.
We connect US companies with vetted developers from tech hubs in Bogota, Medellin, Mexico City, Guadalajara, and Buenos Aires. Below, you’ll find bill-rate breakdowns, regional benchmarks, engagement-model comparisons, and seven contract line items to demand before you sign.
How Are Staff Augmentation Rates Actually Calculated?
Every augmentation proposal arrives as a single hourly number. That number hides four cost layers, each with its own margin. Breaking the stack apart converts rate negotiations from guesswork into financial precision.
What Is in the Bill-Rate Stack?
A mid-level React developer in Bogota, Colombia earns roughly $4,200/month in direct compensation. That is about $25/hr. The developer’s direct pay represents just 60% of your invoice. The result: a $75/hr bill rate where $45 reaches the developer and $30 funds everything else. That $4,200 Bogotá figure tracks with the wider ranges in our Colombia developer salary benchmarks by role and seniority.
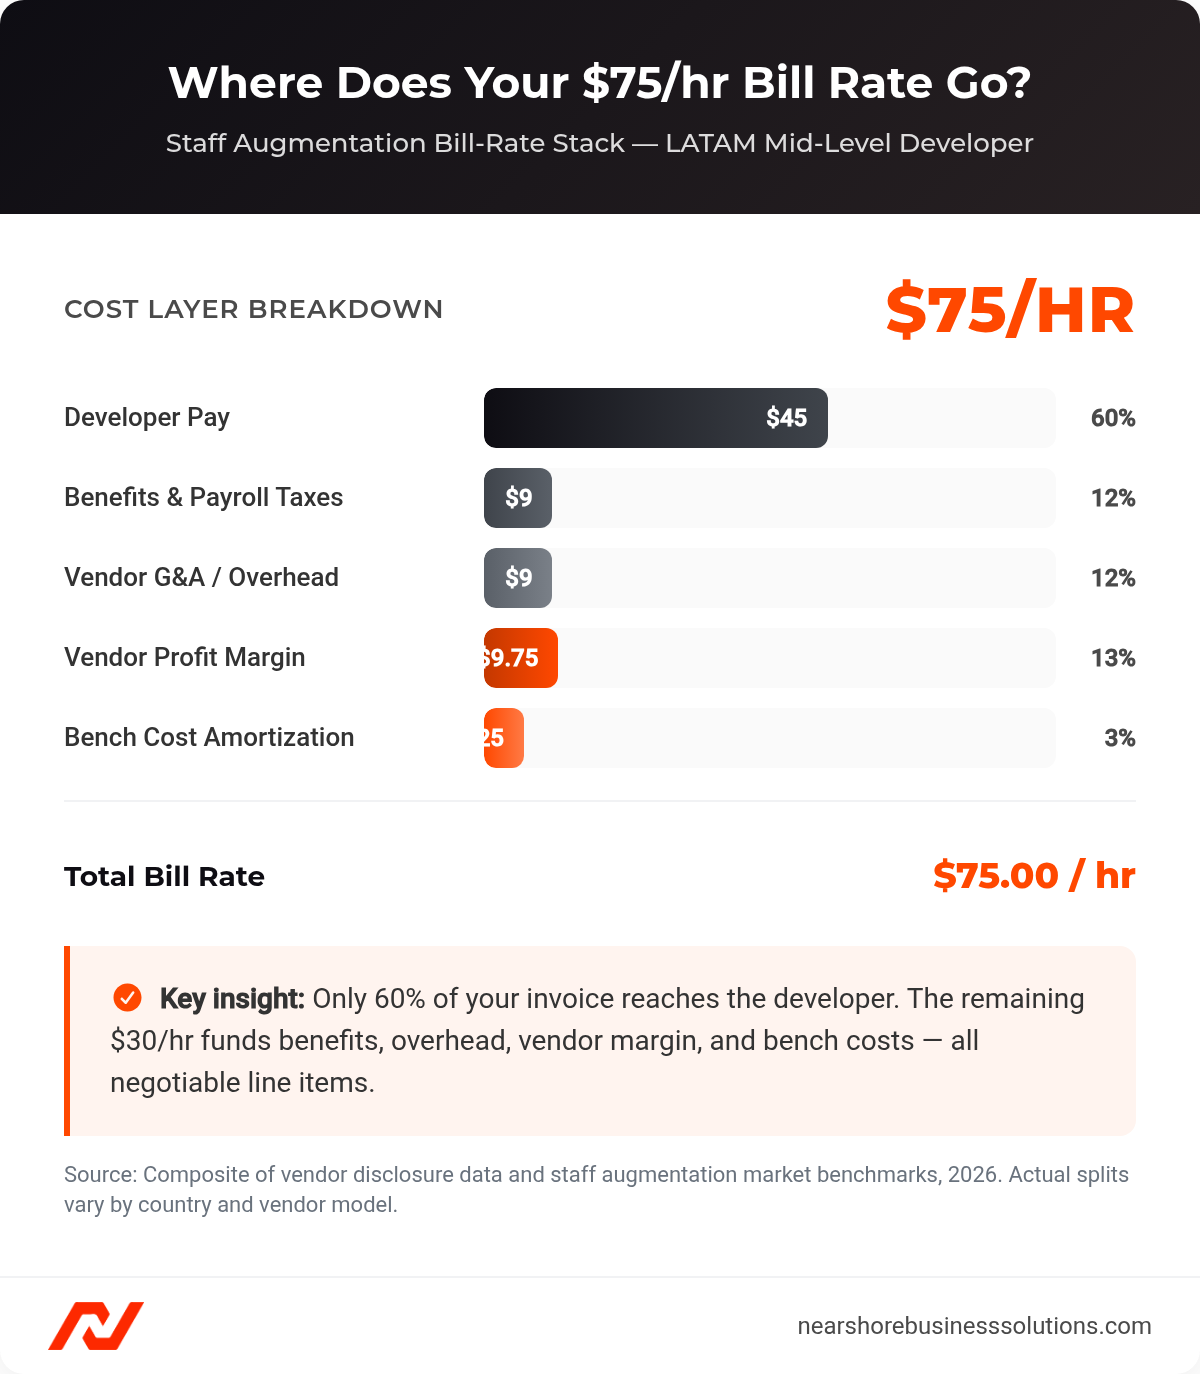
Staff augmentation bill-rate stack: only 60% of the hourly rate reaches the developer.
| Cost Layer | % of Bill Rate | Dollar Amount (at $75/hr) |
|---|---|---|
| Developer Direct Compensation | 60% | $45.00 |
| Benefits and Payroll Taxes | 12% | $9.00 |
| Vendor G&A / Overhead | 12% | $9.00 |
| Vendor Profit Margin | 13% | $9.75 |
| Recruitment and Bench Cost Amortization | 3% | $2.25 |
| Total Bill Rate | 100% | $75.00 |
Source: Staffing Industry Analysts (SIA), “Gross Margin and Markup Trends in Staffing,” 2023; Everest Group, “IT Services Pricing Models: 2023 State of the Market.” Actual splits vary by country, vendor model, and contract structure.
What Does the ICR Tell You That the Hourly Rate Doesn’t?
The ICR (Indirect Cost Rate) measures the ratio of indirect costs to direct labor cost. Indirect costs include benefits, overhead, and bench amortization. They exclude developer compensation and vendor profit. Using the table above: direct labor = $45/hr, indirect costs = $20.25/hr, ICR = 45%. Industry benchmarks place typical ICRs at 20-35% of direct labor (per staffing industry analyst data). Add vendor margin on top and the total cost multiplier lands in the 1.4-1.8x range. The $75/hr example yields 1.67x ($75 divided by $45), which sits inside a healthy band. A multiplier above 2.0x signals vendor bloat. Reverse-engineer it from any proposal by asking for the developer’s fully loaded compensation, then dividing the bill rate by that number.
Why Does “Competitive Rates” Mean Nothing Without the Markup Band?
Vendor markup on fully loaded developer cost is what you actually pay for vendor services above the developer’s direct compensation. A 20-percentage-point markup difference on a ten-person team billed at $75/hr over 12 months adds more than $200,000 in cost for identical output, per SIA markup benchmarks (2023). The right question to ask every vendor: “What is your markup on fully loaded developer cost?”
| Vendor Type | Typical Markup Range | What Drives It |
|---|---|---|
| Large Global SIs (Accenture, Cognizant, Globant, EPAM) | 50-100%+ | Significant overhead, brand premium |
| Mid-Market US-Based Agencies | 40-70% | Domestic overhead, inside sales teams |
| Boutique Nearshore Firms | 30-50% | Leaner G&A, smaller management structures |
Source: Staffing Industry Analysts (SIA), “Gross Margin and Markup Trends in Staffing,” 2023.
A senior LATAM developer with a $65K fully loaded annual cost bills at $49-$56/hr through a boutique firm, $52-$64/hr through a mid-market agency, or $56-$75+/hr through a global SI. The skill set is identical across all three.
What Is the Bench Rate and How Does It Inflate Your Bill Rate?
The bench rate is the percentage of your total bill rate allocated to fund developers who are on the vendor’s payroll but not currently assigned to any client project. Per SIA (2023), bench costs typically represent 3-5% of the total bill rate and are embedded silently in every invoice. Two vendor models handle this differently. Dedicated bench vendors maintain pre-vetted engineers for rapid deployment; you pay a premium for sub-48-hour placement but absorb ongoing bench costs throughout the engagement. JIT (just-in-time) vendors recruit per engagement, eliminating bench overhead but extending time-to-fill by one to three weeks. On a ten-person team at $85/hr, a 5% bench rate allocation equals roughly $17,000/year. This line item is negotiable, especially with JIT vendors, and should always appear as a separate line in the proposal rather than embedded in the blended rate.
See “Seven Line Items to Demand in Every Staff Augmentation Proposal” below for specific contract terms to require.
What Are Typical Staff Augmentation Rates by Region, Role, and Seniority in 2026?
LATAM’s cost advantage over Eastern Europe has widened by roughly 10-15 percentage points since 2023, driven by three concurrent market forces: US tech compensation plateauing post-2023, LATAM talent supply expanding past 2.5 million developers (per CINDE and Talent Alpha market reports), and Eastern European supply tightening due to geopolitical instability.
How Do LATAM Developer Rates Compare to US Onshore and Offshore Alternatives?
LATAM nearshore developers cost 40-60% less than US domestic augmentation at the same seniority level. At the senior level, LATAM saves $70-$90/hr against the US midpoint.
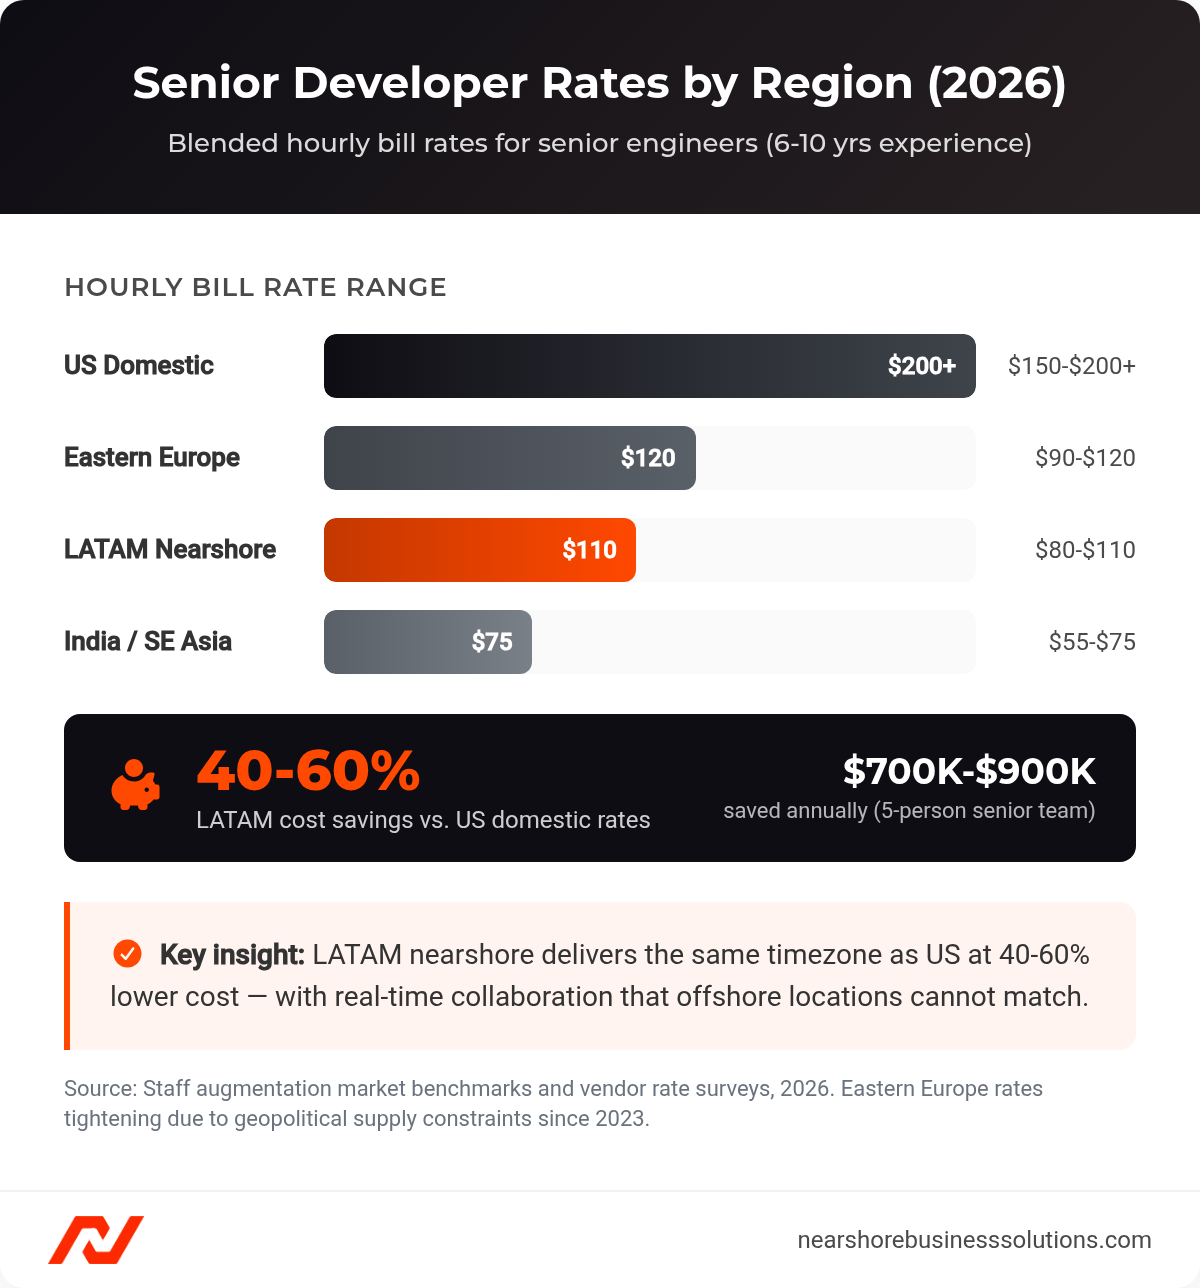
Senior developer bill rates by region in 2026: LATAM saves 40-60% versus US domestic augmentation.
Table 1: 2026 Blended Bill Rates by Region and Seniority
| Seniority Level | US Domestic | Latin America (Nearshore) | Eastern Europe | India / S.E. Asia |
|---|---|---|---|---|
| Junior (1-2 yrs) | $85-$120 | $45-$60 | $50-$70 | $30-$45 |
| Mid-Level (3-5 yrs) | $120-$160 | $60-$85 | $70-$95 | $45-$60 |
| Senior (6-10 yrs) | $150-$200+ | $80-$110 | $90-$120 | $55-$75 |
| Lead / Architect (10+ yrs) | $180-$250+ | $100-$140 | $110-$150 | $70-$95 |
On a five-person senior team working 2,000 hours/year, the LATAM saving compounds to $700,000-$900,000 in annual labor cost reduction compared to US domestic rates.
Table 2: LATAM Country-Level Rate Benchmarks (Senior, 2026)
| Country | Developer Pool | Avg. Senior Rate (USD/hr) | Key Advantages |
|---|---|---|---|
| Brazil | 1,000,000+ | $75-$100 | Largest LATAM pool; deep FinTech and AI/ML expertise |
| Mexico | 700,000+ | $80-$110 | Full US business-hours overlap; Guadalajara’s tech hub |
| Colombia | 200,000+ | $70-$95 | Government IT incentives via Ruta N; maturing ecosystem |
| Argentina | 150,000+ | $65-$90 | Strong CS education from UBA and ITBA; lowest USD rates |
To benchmark a specific role, seniority, and country against current LATAM market data, use the LATAM Salary Calculator. It returns live monthly and fully loaded figures you can drop straight into a vendor RFP or finance model.
What Engagement Model Determines Total Staff Augmentation Cost?
The bill rate tells you what each hour costs. The engagement model determines how many hours you pay for and who absorbs scope risk. A T&M contract (time and materials) is the dominant structure, used in roughly 80-90% of augmentation engagements per Everest Group (2023). Under a T&M contract, the client pays a fixed hourly rate for every hour worked; scope flexibility is maximum but budget risk rests entirely with the buyer. Understanding how to pair model selection with your project timeline is covered in depth in our nearshore development pricing models guide.
| Model | Risk Allocation | Cost Predictability | Rate vs. T&M | Best For |
|---|---|---|---|---|
| Time and Materials | Budget risk on client | Low | Baseline (0%) | Agile development; 80-90% of contracts |
| Fixed-Capacity Pod | Balanced | Medium-High | 5-10% below T&M | Sustained development over 6+ months |
| Fixed-Price | Execution risk on vendor | High | 20-30% premium | Well-scoped projects with stable requirements |
| Outcome-Based | Shared | Variable | Highest potential cost | Strategic partnerships after 12-18 months |
If your roadmap changes quarterly, T&M gives flexibility. If you need a stable squad for 12+ months, a fixed-capacity pod locks in monthly cost 5-10% below equivalent T&M. Treat outcome-based pricing as a Phase 2 evolution once you have 12-18 months of working relationship built.
How Do Staff Augmentation Costs Compare to FTE and 1099 Contractor Alternatives?
Nearshore LATAM augmentation delivers 28% lower annual cost than the US W-2 FTE and 46% lower than US staff augmentation for a senior software engineer. Here is the full comparison at the senior level:
Table 3: Total Cost of Engagement by Model (Senior Software Engineer, 2026)
| Engagement Model | Effective Hourly Rate | Annual Cost (2,000 hrs) | Key Cost Drivers |
|---|---|---|---|
| US W-2 FTE | ~$132 effective | $264,375 | 15-20% annual turnover; 45-60 day time-to-hire |
| US 1099 Contractor | ~$155 | $310,000 | IRS misclassification penalties; IP ownership risk |
| US Staff Augmentation | ~$175 | $350,000 | Vendor management overhead |
| Nearshore LATAM Staff Aug | ~$95 | $190,000 | Vendor management; minor cultural calibration |
| Offshore India Staff Aug | ~$65 | $130,000 | 10.5-13 hr time zone delta; higher attrition cycles |
What Is the FTE Fully-Loaded Cost Most Hiring Managers Underestimate?
The FTE fully-loaded cost of a US senior software engineer is not $185K. It is $264,375, a 1.43x multiplier that most hiring managers underestimate by 15-25% per HR benchmarking data from SHRM and Hired.com 2023.
| Role | Base Salary | Fully Loaded Annual Cost | Multiplier |
|---|---|---|---|
| Junior Engineer | $110,000 | $162,500 | 1.48x |
| Mid-Level Engineer | $150,000 | $217,500 | 1.45x |
| Senior Engineer | $185,000 | $264,375 | 1.43x |
| Staff / Principal | $240,000 | $338,000 | 1.41x |
What Goes Into the 1.4x-1.5x Multiplier:
| Component | Typical Cost |
|---|---|
| Employer Payroll Taxes (FICA 7.65%, FUTA 0.6%, SUTA ~2.7%) | ~8.5-10% of salary |
| Health Insurance | $7,911/yr single; $16,357/yr family (per KFF 2024 Employer Health Benefits Survey) |
| 401(k) Match | 3-5% of salary |
| PTO Cost | ~8% of salary |
| Equipment and Tooling | $2,500-$4,000/yr |
| Recruiting Cost (amortized over 2-year tenure) | $25,000-$40,000 |
| Onboarding and Training | $2,000-$3,000 first year |
The FTE’s Year 1 effective cost rises to $329,000-$349,000 when you add amortized recruiting ($30,000, per SHRM 2022 Talent Acquisition Benchmarking Report) and 3-6 months of reduced productivity ($35,000-$55,000 in lost output, per Greenhouse 2023 Tech Hiring Benchmarks). That is 73-84% higher than the nearshore alternative. The breakeven with FTE arrives at Month 14-18. But it only holds if the engineer stays. With voluntary turnover running 15-20% annually (Dice, “2023 State of Tech Talent Report”), each departure triggers replacement costs of 50-200% of annual salary, or $92,500-$370,000 for a senior engineer (SHRM), and resets the clock. Augmentation vendors handle backfill at no additional recruiting cost, typically within 5-10 business days.
Proper onboarding structure reduces both ramp-up time and early attrition risk. Our staff augmentation onboarding guide covers the process in detail.
What Compliance Risks Make 1099 Contractors Expensive?
Senior US 1099 contractors bill $130-$180/hr. That rate looks cheaper than US staff augmentation at first. But the comparison ignores the compliance risk you self-insure. The IRS applies a three-factor test (behavioral control, financial control, relationship of the parties) to determine worker status. If a 1099 contractor works set hours on your sprint schedule, uses your Jira instance, and reports to your engineering manager, that worker functions as an employee. Misclassification triggers back payroll taxes plus a 1.5% penalty on total wages, 40% of the worker’s uncollected FICA, and 100% of the employer’s unpaid matching FICA. A single adverse ruling can exceed $50,000 per worker (per IRS Schedule D guidance).
California’s AB5 applies a strict “ABC test” that makes classifying embedded software developers as contractors functionally impossible. New York, New Jersey, Illinois, and Massachusetts enforce similar statutes. Under US copyright law, 1099 contractor work defaults to contractor ownership unless an explicit IP assignment clause exists. Staff augmentation vendors serve as employer of record, triggering work-for-hire protections automatically.
Risk-adjusted: a $155/hr contractor with 5-10% annualized compliance exposure has an effective cost of $163-$171/hr. A nearshore augmented engineer at $95/hr delivers the same output at 44% lower risk-adjusted cost.
When Does Augmentation Win on Cost and When Does It Lose?
Augmentation wins for projects that are variable-scope, short-term, or require skills you can not hire fast enough. FTE wins for core competency roles where retention exceeds 85% over 18+ months.
| Scenario | Recommended Model | Why |
|---|---|---|
| 3-12 month project, variable scope | Staff Augmentation | Flexibility without long-term commitment |
| 12+ month sustained role, core competency | FTE Hire | Cheaper after 14-18 month breakeven if retention holds |
| Ultra-short scoped task (under 3 months) | 1099 Contractor | Genuine independence; minimal integration overhead |
| Specialized skill gap for 6 months | Staff Augmentation | Niche talent in 2-3 weeks vs. 45-60 day FTE cycle |
| Scaling from 3 to 10 engineers quickly | Nearshore Staff Augmentation | Fastest ramp; savings compound per seat |
| Predictable ongoing development (6+ months) | Fixed-Capacity Pod | 5-10% below T&M with better budget predictability |
If your trailing-12-month voluntary engineering attrition exceeds 18%, the FTE breakeven extends past 24 months. Augmentation remains cost-superior even for sustained needs in that scenario.
What Are 7 Line Items to Demand in Every Staff Augmentation Vendor Proposal?
Vendor proposals that arrive as two-page summaries discourage comparison by design. Demand these seven items from every vendor before signing:
- Markup percentage on fully loaded cost (not just base salary)
- Bench cost allocation, ramp-up period billing, and replacement SLAs
- Currency risk, inflation escalators, and rate-lock terms
- IP ownership and assignment clauses – Require explicit IP assignment in the MSA. Work-for-hire protections do not apply without it.
- Termination and exit clause costs – Hidden severance pass-throughs can add 2-4 months of cost.
- Rate escalation caps and review triggers – Cap annual increases at 3-5%; tie reviews to specific contract anniversaries.
- Tooling, access provisioning, and security compliance costs – Equipment and licenses run $2,500-$4,000/yr per developer. Clarify who pays upfront.
How Should You Evaluate Markup Percentage on Fully Loaded Cost?
Reference the markup bands above. Boutique nearshore firms: 30-50%. Mid-market agencies: 40-70%. Global SIs: 50-100%+. Require vendors to state markup as a percentage of fully loaded developer cost, not base salary. A “25% markup on base salary” and a “25% markup on fully loaded cost” produce materially different bill rates. If base salary is $40/hr and fully loaded cost is $52/hr, the first yields a $50/hr bill rate while the second yields $65/hr. Require the formula in writing and verify it against the bill-rate stack.
How Should You Evaluate Bench Costs and Replacement SLAs?
Three questions to resolve before signing. First: is bench cost embedded in your rate, and at what percentage? Demand it as a separate line item. Second: does billing begin Day 1 or after a defined ramp period? New developers take 3-6 months to reach full productivity on an unfamiliar codebase. Negotiate a reduced rate for the first 2-4 weeks. Third: what is the guaranteed replacement timeline if a developer leaves? Industry standard is 5-15 business days. Require the vendor to absorb the cost gap during the replacement window. If they won’t, that signals low confidence in their retention.
What Currency and Rate-Lock Terms Should You Require for LATAM Contracts?
LATAM contracts are typically denominated in USD, but vendor costs are incurred in local currency. This creates exposure when the Colombian peso, Mexican peso, or Brazilian real shifts. Argentina’s macroeconomic volatility makes this especially acute. The region’s lowest USD rates come with its highest retention risk due to currency fluctuations. Negotiate rate-lock periods of 6-12 months and cap annual escalation at 3-5%. Require that any mid-contract adjustment be tied to specific inflation indices, not vendor discretion.
How Do You Reduce Staff Augmentation Costs Without Sacrificing Developer Quality?
You have four levers: blended-rate negotiation, seniority-mix optimization, engagement model selection, and contract structure. The first two are the fastest to act on.
How Can Blended Rates on Multi-Role Teams Reduce Costs?
Instead of negotiating each role individually, negotiate a single blended rate across a team pod. The rate differential between seniority levels is significant. LATAM junior engineers run $45-$60/hr versus seniors at $80-$110/hr. A blended rate across a mixed team smooths these peaks. This gives the vendor flexibility to manage margin across seniority levels and typically yields 8-15% savings versus individual pricing on teams of four or more.
Why Is an All-Senior Team the Most Expensive Configuration?
A well-structured team with a senior lead, mid-level developers, and a dedicated QA engineer outperforms a flat all-senior team in cost and often in output. Here is the math on a five-person LATAM team:
| Team Composition | Blended Rate | Annual Cost (5 devs x 2,000 hrs) | Savings vs. All-Senior |
|---|---|---|---|
| All-Senior: 5 x $95/hr | $95/hr | $950,000 | Baseline |
| Balanced: 1 lead ($120) + 2 senior ($95) + 1 mid ($72) + 1 QA ($55) | $87.40/hr | $874,000 | ~8% |
| Cost-Optimized: 1 senior lead ($120) + 2 mid ($72) + 1 junior ($52) + 1 QA ($52) | $73.60/hr | $736,000 | ~22.5% |
The cost-optimized mix saves $214,000 annually. That is enough to fund an additional 2.5 mid-level engineers. The senior lead provides architectural guidance that maintains code quality across the team. Every augmentation request that defaults to “all senior” without examining actual work complexity is leaving six figures on the table.
For a full breakdown of how nearshore staffing models affect cost structure, see our guide to staff augmentation services.
Frequently Asked Questions About Staff Augmentation Costs
These are the most common questions CFOs and engineering leaders ask when evaluating staff augmentation costs and models.
How Long Does It Take to Place a Staff Augmentation Developer?
Nearshore LATAM augmentation typically delivers your first pre-vetted candidates within 3 business days. US domestic augmentation through large SIs runs 4-8 weeks. The fastest placements come from dedicated bench vendors, who can deploy a pre-vetted engineer in under 48 hours for a rate premium.
What Happens If a Developer Does Not Work Out?
Most augmentation vendors offer a replacement SLA of 5-15 business days. Require the vendor to absorb the billing gap during the replacement window. If they will not, negotiate a partial credit. The quality of this SLA is one of the clearest signals of a vendor’s retention confidence.
Do I Need to Provide Equipment to Augmented Developers?
Equipment and tooling responsibility depends on the contract. Many nearshore vendors include equipment provisioning in their overhead (built into the 12% G&A layer of the bill rate). Clarify this upfront. If it is not included, budget $2,500-$4,000/yr per developer for laptops, software licenses, and security tooling.
How Do I Pay LATAM Staff Augmentation Vendors?
Nearly all LATAM augmentation contracts are denominated in USD, billed monthly or bi-weekly. The vendor handles local payroll, benefits, and statutory contributions in the developer’s home country. You pay a single USD invoice. No local entity or payroll infrastructure is required on your side.
What Is the Difference Between Nearshore and Offshore Staff Augmentation?
Nearshore means same or near-same timezone (LATAM to US: 0-3 hour delta). Offshore means a large timezone gap (India/SE Asia to US: 10.5-13 hours). Nearshore enables real-time collaboration on sprint ceremonies and code reviews. Offshore typically requires overlap windows that limit synchronous work to 2-4 hours per day, which increases async overhead and extends feedback loops.
Do I Need a Local Entity to Hire Through Staff Augmentation?
No. The augmentation vendor acts as employer of record in the developer’s home country. You have no local payroll obligation, no entity registration, and no exposure to local labor law. This is one of the structural advantages of augmentation over direct hiring or 1099 arrangements in LATAM.
What Security and Compliance Certifications Should I Require From LATAM Vendors?
Require vendors to hold or operate under SOC 2 Type II, ISO 27001, or both. For healthcare clients, confirm HIPAA-compatible data handling practices. Colombia’s Law 1581 and Brazil’s LGPD govern data privacy for developers in those countries. A reputable vendor will proactively address these in the MSA rather than waiting for you to ask.
Is Staff Augmentation the Right Cost Model for Your Engineering Team?
Staff augmentation is the right choice when speed, flexibility, and cost savings matter more than long-term ownership of the role. It wins on every cost dimension against US domestic alternatives for engagements under 18 months. For sustained needs, the choice depends on your retention rate and time horizon.
The single most impactful decision is region selection. LATAM nearshore augmentation at $45-$140/hr delivers real-time collaboration, 40-60% cost reduction versus US rates (per 2023 industry rate benchmarks), and a talent pool that is growing faster than any other region in the market.
Ready to Get LATAM Staff Augmentation Pricing for Your Team?
Nearshore Business Solutions connects you with vetted developers across Colombia, Mexico, Argentina, and Brazil. We source, vet, and place engineers screened for technical skills, English fluency, and US work style fit. Every placement includes a 90-day replacement guarantee.
Get a free staff augmentation quote and receive LATAM developer pricing for your specific roles within 24 hours.