
Why Developer Vetting Nearshore Defines Engagement Success Before a Single Sprint Begins
A mis-vetted nearshore developer costs a team 3 to 6 months of lost velocity before the replacement conversation even starts. Over 95% of nearshore firms claim “rigorous” vetting, yet fewer than 30% can document a multi-stage process.
Those figures come from a 2023 analysis of more than 500 nearshore outsourcing firms on Clutch.co, which found that almost all use terms like “top 1%,” “elite,” or “rigorously vetted” in their marketing while a minority could produce evidence of live coding, system design, and structured behavioral interviews. Vetting quality is the single highest-leverage variable in nearshore engagement outcomes, yet most buyers treat it as a vendor checkbox rather than a predictive filter.
The failure modes are specific. A developer who passed a vendor’s screening stalls on the first ambiguous ticket because nobody tested their ability to clarify requirements asynchronously. A “senior” engineer delivers working code but cannot reason about bounded contexts, so every PR introduces coupling that the US team spends hours untangling. Each of these profiles clears a weak vetting process. None of them survive contact with a real product team operating at tempo.
The Hidden Cost of Rubber-Stamp Screening
The U.S. Department of Labor estimates the average cost of a bad hire at 30% of first-year earnings, or $54,000 for a senior engineer at $180,000. SHRM’s 2023 analysis puts the fully loaded cost at 3x to 4x the position’s salary when factoring in lost productivity, morale impact, and recruitment fees, exceeding $500,000 for a single senior role.
The damage propagates predictably. A developer who can solve LeetCode mediums but cannot decompose a feature into well-bounded tasks generates velocity debt: PRs requiring 3 to 4 review cycles, architectural decisions creating rework two sprints later, and questions pulling senior IC time from critical-path work.
> **Case Study, Series B HealthTech:** A HealthTech company hired three “senior” full-stack developers through a staffing generalist whose vetting was a 30-minute technical chat. Within 60 days, all three lacked the architectural skills to work independently. Two hires were terminated. The project slipped four months. Estimated cost: $200,000 in lost productivity and rework.How Nearshore Firms Vet Developers Differently Than Onshore Staffing Agencies
Top-tier nearshore firms run 5 to 8 screening stages against the 1 to 2 stages a typical onshore staffing agency uses, and they place from a pre-vetted bench in 10 to 15 business days instead of 49-plus.
| Attribute | Onshore Staffing Agency | Top-Tier Nearshore Firm |
|---|---|---|
| Primary screening method | Resume parsing plus single behavioral call | Multi-stage: automated coding, live coding, system design, English assessment, take-home project, background check |
| Interviewer profile | Recruiters using keyword checklists | Full-time senior/principal engineers with calibration training |
| Typical screening stages | 1 to 2 | 5 to 8 |
| Average time-to-hire | 49+ days (up to 70+ for specialized roles, per the 2024 Greenhouse report) | 10 to 15 business days from pre-vetted bench |
| System design evaluation | Rare | Standard for mid-senior+ roles |
| English/communication evaluation | Assumed (native market) | Calibrated assessment (CEFR B2+ minimum) across written and spoken channels |
The time-to-hire delta matters: a top-tier nearshore firm with a pre-vetted bench places developers in 10 to 15 business days because vetting happened months before you submitted a role requirement. Firms without a bench take 4 to 8 weeks, compressing the same multi-stage process into a timeline that creates pressure to cut corners.
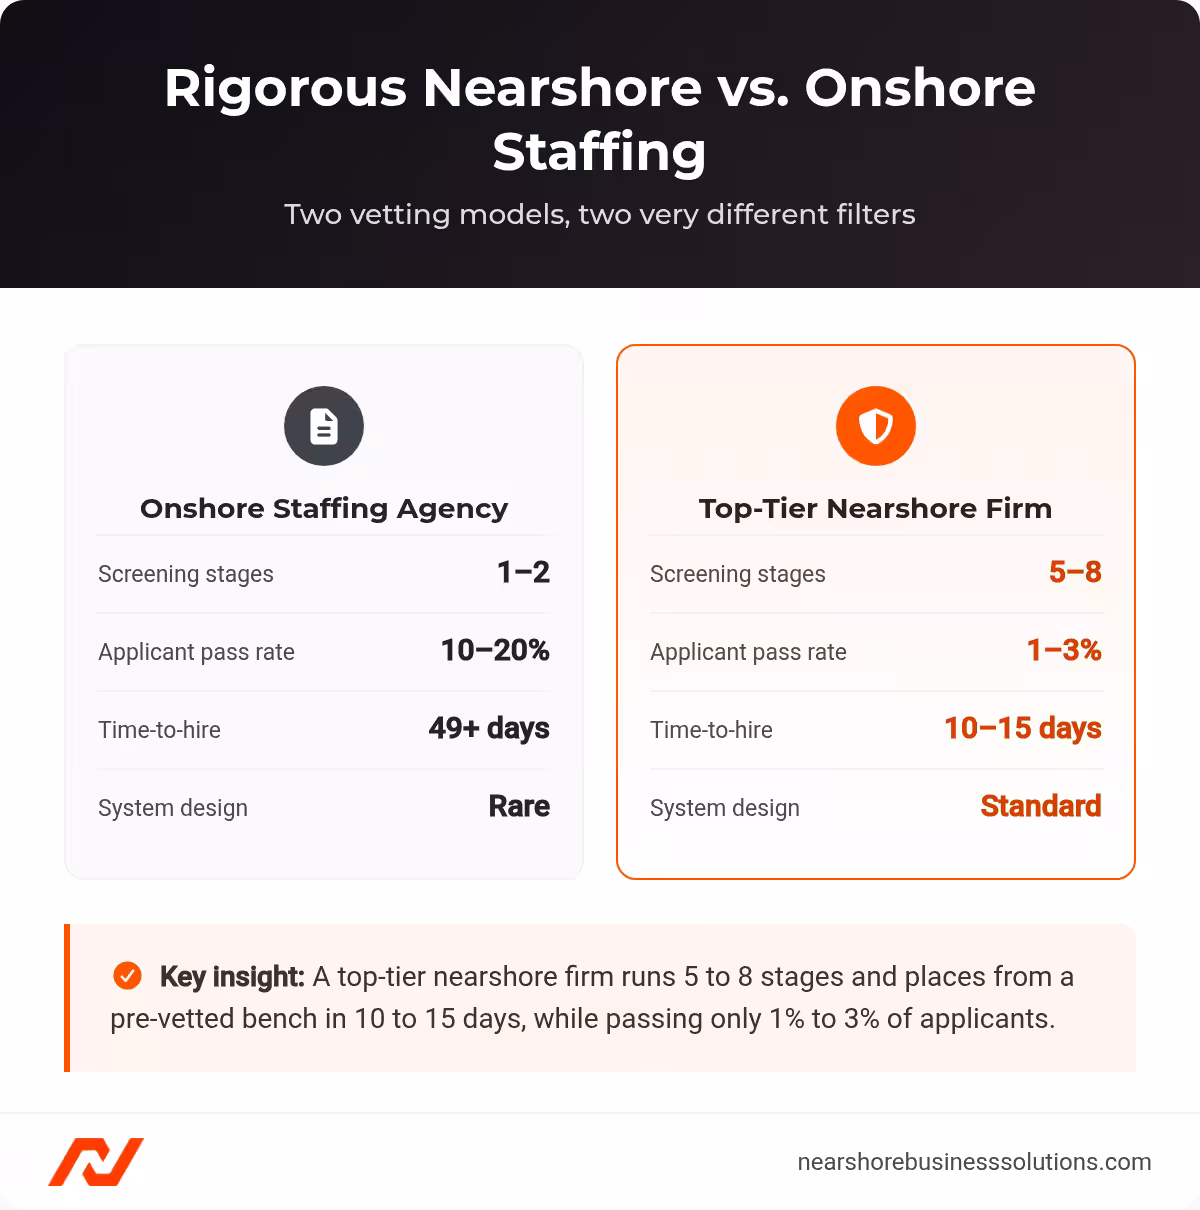
Onshore staffing versus top-tier nearshore vetting across four screening dimensions.
For a broader vendor evaluation framework that extends beyond vetting, use the Evaluate Nearshore Development Partners Checklist as a companion resource. If you plan to run final interview rounds yourself, our guidance on how to interview remote candidates in Latin America covers the question sets and scoring rubrics US teams use.
What Does a Rigorous Nearshore Developer Screening Funnel Look Like Stage by Stage?
A rigorous funnel admits roughly 18 hires per 1,000 applicants, a 1.8% pass rate. Top-tier LATAM firms publicly report overall pass rates between 1% and 3%, while traditional IT staffing generalists pass 10% to 20%, a rate achievable only by collapsing the funnel into one or two surface-level checks.
The stage-by-stage pass-through rates below reflect benchmarks NBS tracks across our placement funnel and corroborating vendor-reported data; treat them as planning ranges rather than fixed industry constants.
| Stage | What It Measures | Typical Pass-Through Rate | Cumulative Survivors (per 1,000) | Red Flags If Missing |
|---|---|---|---|---|
| 1. Resume/Portfolio Screen | Baseline experience relevance | 40 to 50% | ~450 | No role-specific scorecards |
| 2. Automated Coding Test | Core algorithms, language proficiency (HackerRank, Codility: timed, proctored) | 35 to 45% | ~180 (rubber-stamp firms STOP here) | No proctoring or plagiarism detection |
| 3. Live Coding Interview | Problem decomposition, communication under pressure (CoderPad/Karat with senior engineer) | 40 to 50% | ~80 | No human interviewer; correctness-only scoring |
| 4. System Design (Mid-Senior+) | Architectural reasoning, scalability, tradeoff articulation | 30 to 40% | ~28 | Skipped for senior roles, a critical red flag |
| 5. English & Communication | Professional fluency: written async plus spoken sync (CEFR B2+ minimum) | 60 to 70% | ~18 | No written evaluation |
| 6. Take-Home Project | Code quality, documentation, pragmatic architecture (4 to 6 hour scoped project) | 50 to 60% | ~10 | No code review step |
| 7. Behavioral & Culture Fit | Autonomy, proactivity, async work maturity (STAR method with rubric) | 80 to 90% | ~8 | No defined rubric |
| 8. Background & References | Employment/education verification (localized for LATAM) | 95 to 98% | ~8 | No localized checks |
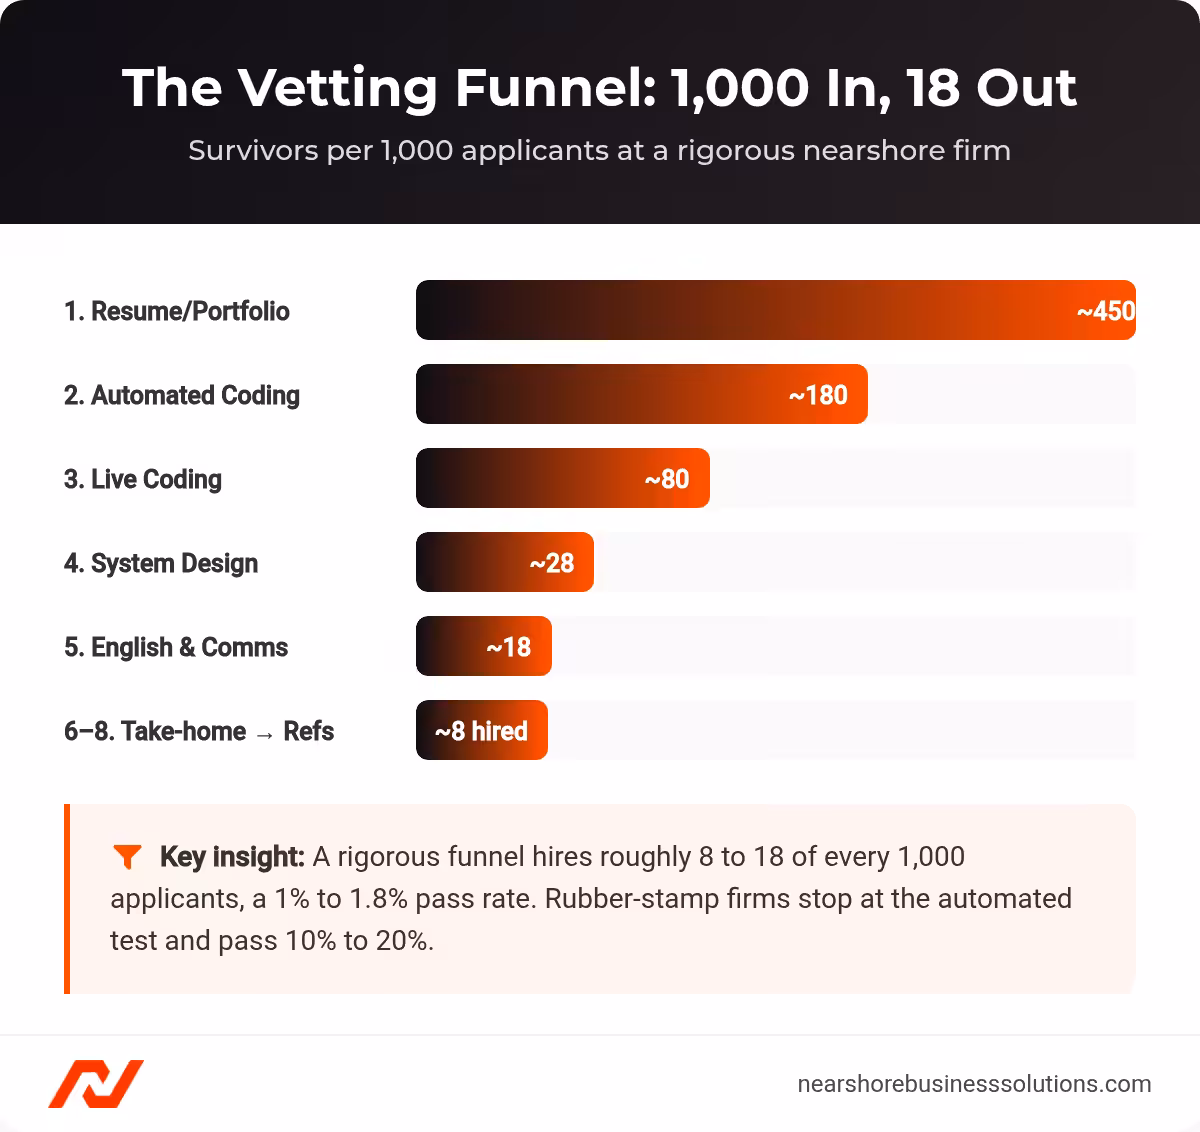
Applicant attrition through a rigorous eight-stage nearshore vetting funnel.
For external calibration: CoderPad’s 2023 report found that globally, only 12.6% of candidates who begin a technical assessment pass it. HackerRank’s 2023 Developer Skills Report showed role-specific pass rates below 5% when benchmarked against top tech company standards. A vendor claiming rigorous screening while passing 15% of applicants operates at a fundamentally different calibration level.
Stage 3 & 4: Live Coding and System Design, Where Real Signal Lives
Automated tests measure whether a developer can solve a problem. Live coding measures whether they should be trusted to solve problems inside your codebase. The evaluator watches how the candidate arrives at a solution: do they restate the problem, identify edge cases unprompted, propose a brute-force approach then optimize, and narrate tradeoffs?
System design separates feature-builders from system-builders. Three prompts that reliably test senior architectural thinking:
- “Design a rate limiter for an API gateway serving 50,000 requests/second.” Tests distributed systems knowledge, consistency vs. availability tradeoffs, and failure behavior under burst traffic.
- “Walk through migrating a monolith order-processing service to microservices for a team that ships weekly.” Tests incremental migration strategy, bounded context identification, and deployment risk management.
- “Design the notification system for a healthcare platform where message delivery is auditable and latency-sensitive.” Tests event-driven architecture, message queue selection, and compliance-aware design.
A vendor that skips system design for any role labeled “senior” has removed the single most predictive stage for architectural competence.
Stage 5: English Fluency and Async Communication
An estimated 20% to 25% of the total LATAM developer pool possesses B2+ English proficiency, according to regional proficiency benchmarks such as the EF English Proficiency Index. That means 75% to 80% of technically qualified candidates cannot operate effectively on an English-speaking distributed team. English assessment is a structural filter, not a courtesy check.
Distributed teams communicate asynchronously by default through Slack threads, PR descriptions, and RFC documents. A developer who speaks fluently in a synchronous interview but cannot write a clear Slack message explaining a tradeoff decision creates a bottleneck in every review cycle. Top-tier firms evaluate both channels: spoken fluency and a written simulation where the candidate drafts a Slack thread explaining a technical decision or reviews a mock PR.
Stages 6 to 8 and Trial Period
- Take-Home Project (Stage 6): A 4 to 6 hour scoped project submitted via Git repo for structured code review. Pass rate: 50% to 60%. A $15M ARR SaaS company engaged a nearshore partner in Uruguay whose vetting included a take-home feature prototype, and the app launched two months ahead of schedule.
- Behavioral & Culture Fit (Stage 7): STAR method interviews targeting async work competencies: autonomy, blocker resolution, and asynchronous conflict resolution. Pass rate: 80% to 90%. Red flags: passive communication and absence of ownership language.
- Background & References (Stage 8): Localized checks adapted for LATAM jurisdictions plus structured reference calls. Pass rate: 95% to 98%.
- Trial Period (Post-placement): A 2-week to 30-day paid trial. Pass rate: ~98% when the upstream funnel operates at full rigor. Mis-hire rates spike to 10% to 15% when vendors compress earlier stages, based on NBS placement data across engagements.
How Do You Spot Rubber-Stamp Vetting? 7 Red Flags Every VP of Engineering Should Catch
Most buyers never inspect the funnel: a 2024 Staffing Industry Analysts survey found that 68% of technology buyers evaluate fewer than three vendors before signing, and fewer than half request documented evidence of screening before placement begins.
The Consolidated Red Flag Checklist
| # | Signal | What to Ask Instead |
|---|---|---|
| 1 | Extreme speed claims, like “qualified candidates in 24 to 48 hours” | “Are these from a pre-vetted bench or a net-new search? How many screening stages did each complete?” |
| 2 | Vague process description, like “AI-powered matching” without specifics | “Name each stage, the dimensions scored, and the pass rate at each stage.” |
| 3 | No dedicated technical interviewers, with recruiters conducting screens | “Share LinkedIn profiles of engineers who conduct interviews. What calibration process do they follow?” |
| 4 | High candidate volume, presenting 5 to 10 profiles per role | “How many developers in your pool have completed every screening stage?” |
| 5 | No pass-rate data, or vanity metrics with manipulated denominators | “Provide your applicant-to-placement ratio from initial application to signed engagement.” |
| 6 | Recycled bench profiles, with broad skill tags and universal availability | “How long has this candidate been benched, and what structured engagement have they completed?” |
| 7 | “Culture fit” with no rubric | “Share the rubric, interview guide, and pass/fail thresholds for your behavioral evaluation.” |
Mid-size nearshore firms typically maintain benches of 50 to 150 pre-vetted developers at significant cost overhead. In NBS re-assessment data, developers benched 90+ days without structured engagement scored roughly 18% lower than at initial placement. A trustworthy partner proactively provides detailed stage-by-stage documentation, anonymized scorecards, cohort-level funnel metrics, and profiles of technical interviewers. For teams that would rather hand the entire funnel to a partner, our recruitment-as-a-service model applies the same scorecard logic to your pipeline end to end.
Questions That Reveal Vetting Depth
Eight high-signal questions for your next vendor call:
- “Walk me through your vetting process stage by stage with pass rates.” Good: Names 5 to 8 stages with specific percentages. Bad: “Three-step process, resume, HR call, technical chat.”
- “Who conducts live coding and system design interviews?” Good: Full-time senior engineers, calibrated quarterly. Bad: “Our talent acquisition specialists are technically trained.”
- “Can you share an anonymized completed scorecard?” Good: Produces rubric dimensions with granular scores and evaluator notes. Bad: “That’s proprietary.”
- “How do you assess proactive communication and remote work maturity?” Good: Structured STAR-method behavioral interview with explicit pass/fail criteria. Bad: “We get a feel for their communication style.”
- “What is your applicant-to-placement ratio for Senior Backend Engineer?” Good: “Approximately 100:1, roughly 1%.” Bad: “We have extensive networks.”
- “Do you assess written English separately from spoken?” Good: References CEFR with a B2 minimum, names specific tools, confirms written evaluation. Bad: “We confirm proficiency during the interview.”
- “Average bench tenure and structured engagement during that period?” Good: Under 60 days with documented upskilling and re-assessment. Bad: Cannot answer, or exceeds 90 days with no plan.
- “Replacement policy if a developer doesn’t meet expectations in 30 days?” Good: A written satisfaction guarantee with free replacement within a defined SLA. Bad: No policy, or charges full fees regardless.
When a Vendor Invites You to Co-Design the Vetting Process, That Is the Strongest Green Flag
Firms that resist transparency do so because their process cannot survive external inspection. Co-design takes specific forms: the vendor invites your engineers to conduct final interview stages, shares live scorecard data after each round, asks you to define role-specific evaluation criteria, and proposes joint calibration sessions.
> **Case Study, US FinTech ($40M ARR, Series C):** This company partnered with a nearshore firm operating an eight-stage funnel with a pre-vetted bench across Brazil and Colombia. The firm structured the final two rounds as client-conducted sessions, providing scorecard data from prior stages. Result: eight senior data engineers hired in six weeks. Time-to-hire dropped 65%. Sprint velocity increased 15% within the first quarter. Fully loaded cost per engineer came in 55% below US market equivalents.Ask every vendor on your shortlist: “Can our senior engineers conduct the final interview rounds, and will you share your scorecard data from prior stages?”
A “yes” backed by a documented co-design process is the strongest signal that a vendor’s vetting claims will survive contact with your sprint cycle.
If you want a partner whose vetting process is designed to be audited, not hidden, explore our remote talent acquisition model and see the funnel from the inside.