
Why Engineering Leaders Are Racing to Hire .NET Developers in Latin America
The U.S. Bureau of Labor Statistics projects 17% growth in software developer demand through 2033, roughly 140,000 net new roles per year, while domestic CS graduation rates remain flat at approximately 100,000 annually. That structural deficit hits .NET teams hardest: C# ranks among the most demanded enterprise backend languages, yet U.S. .NET developer supply has contracted as junior talent gravitates toward JavaScript/Python ecosystems and senior engineers get absorbed by FAANG compensation packages. LinkedIn Talent Insights data consistently shows .NET and C# roles sitting in the top quartile for time-to-fill, with median open-requisition periods stretching beyond 60 days in major metros (Hired.com, 2023).
Latin America closes that gap with scale, speed, and economics. The region holds an estimated 1.2 to 1.4 million software developers as of early 2024, with Brazil and Mexico accounting for over 60% of that pool (Statista, “Number of Software Developers in Latin America 2023”; Evans Data Corporation Global Developer Population Study, 2023). Applying Stack Overflow’s 2023 finding that 27.62% of professional developers use C# yields an estimated LATAM .NET/C# talent pool of 171,000 to 216,000 engineers: Brazil (75,000 to 90,000), Mexico (45,000 to 60,000), Colombia (20,000 to 25,000), Argentina (18,000 to 22,000), Chile (8,000 to 12,000), and Costa Rica (5,000 to 7,000). This pool is growing, not shrinking.
U.S. domestic .NET hires cost $25,000 to $40,000 in total recruitment spend and take 55 to 70 days to close (Hired.com, 2023). LATAM nearshore hires run $12,000 to $20,000 with cycle times of 25 to 40 days when using a specialized partner (Terminal.io, “State of Remote Engineering 2023”). Companies leveraging nearshore LATAM talent report average all-in cost savings of 45 to 60% compared to domestic hires in major U.S. tech hubs (Deloitte Global Outsourcing Survey, 2022). Engineering leaders who frame nearshoring as “cheaper developers” miss the strategic point: LATAM offers a defensible, growing talent pipeline in a language ecosystem where U.S. supply is structurally declining.
If your stack extends beyond .NET, the same talent market serves backend and full-stack engineers across the region with the same time-zone and cost advantages. Browse our Latin America role guides for a full breakdown by specialization.
Timezone Overlap Gives LATAM a Structural Edge Over Offshore Alternatives
Synchronous communication determines sprint velocity for .NET enterprise teams running daily standups, code reviews, and production incident response.
| City/Region | Country | Overlap with U.S. Eastern (hrs) | Overlap with U.S. Pacific (hrs) |
|---|---|---|---|
| Bogota / Medellin | Colombia | 9 | 6 |
| Mexico City / Guadalajara | Mexico | 7 | 8 |
| Sao Paulo / Buenos Aires | Brazil / Argentina | 7 | 4 |
| Bangalore | India | 0 to 1.5 | 0 to 1 |
| Warsaw | Poland | 2 to 3 | 0 to 1 |
Teams with at least 4 hours of timezone overlap report 30% faster project completion times compared to teams with minimal overlap (Accelerance, “The Business Case for Nearshore Software Development,” 2022). Synchronous communication reduces bug resolution time by an average of 24 to 36 hours (Journal of Software: Evolution and Process). Gartner’s 2023 report on software engineering team structure states it directly: “Distributed teams in adjacent time zones consistently outperform those in disparate zones on metrics like deployment frequency and lead time for changes.”
For .NET-specific workflows, this advantage compounds. Enterprise .NET projects involve tightly coupled dependencies, shared NuGet packages, Azure DevOps CI/CD pipelines, and Entity Framework migrations that can break downstream services. A breaking change pushed at 3 PM Eastern needs a real-time conversation with the developer who owns the affected service. With a Colombia-based team, that conversation happens the same afternoon. With a Bangalore-based team, it waits 12 to 14 hours.
Why .NET and C# Are Thriving in Brazil, Mexico, and Colombia
Microsoft has invested aggressively in LATAM’s developer ecosystem. LinkedIn searches surface 30,000+ Microsoft Certified Azure Developer Associate profiles in Brazil and 15,000+ in Mexico as of Q3 2023. These certifications require demonstrated proficiency in Azure App Services, Azure Functions, Cosmos DB, and .NET-based cloud architectures.
Three structural forces drive .NET’s strength: LATAM’s financial sector, including Brazil’s Nubank, Colombia’s Bancolombia, and Mexico’s BBVA Mexico, runs heavily on C#/.NET for core banking and payment processing. Microsoft’s Azure regions across Brazil and Mexico have pulled local developer communities deeper into the .NET/Azure ecosystem. And Microsoft Learn, the MVP program, and regional .NET Conf events have built dense knowledge-sharing networks that accelerate skill development. C# dominates LATAM’s finance, e-commerce, and corporate enterprise sectors (Stack Overflow 2023 regional analysis), which means U.S. engineering leaders hiring from this pool get developers whose default context is production-grade, compliance-aware, enterprise software.
What Does It Actually Cost to Hire ASP.NET Developers From LATAM in 2026?
2026 .NET Developer Salary Benchmarks
Base compensation for LATAM .NET developers has risen 8 to 12% annually since 2022 as U.S. nearshore demand competes with local enterprise hiring (Arc.dev Global Developer Salary Explorer, 2024; Deel Global Hiring Report, 2023). Projecting that trend forward produces the following 2026 benchmarks:
| Seniority Level | United States | Brazil | Mexico | Argentina | Colombia |
|---|---|---|---|---|---|
| Mid-Level (3 to 5 yrs) | $120K to $150K | $45K to $65K | $40K to $58K | $30K to $48K | $32K to $50K |
| Senior (5 to 8 yrs) | $150K to $190K | $65K to $90K | $58K to $80K | $48K to $68K | $50K to $70K |
| Staff/Lead (8+ yrs) | $190K to $240K | $85K to $120K | $75K to $105K | $60K to $85K | $65K to $90K |
Rates reflect fully-loaded contractor rates or gross salary equivalents. Argentina figures use the parallel (“blue dollar”) exchange rate commonly applied to tech-sector compensation. Sources: Robert Half 2024 Salary Guide; Hired.com “State of Software Engineers” 2023; Arc.dev 2024; Glassdoor and PayScale Q3 2023 data projected forward at observed annual growth rates.
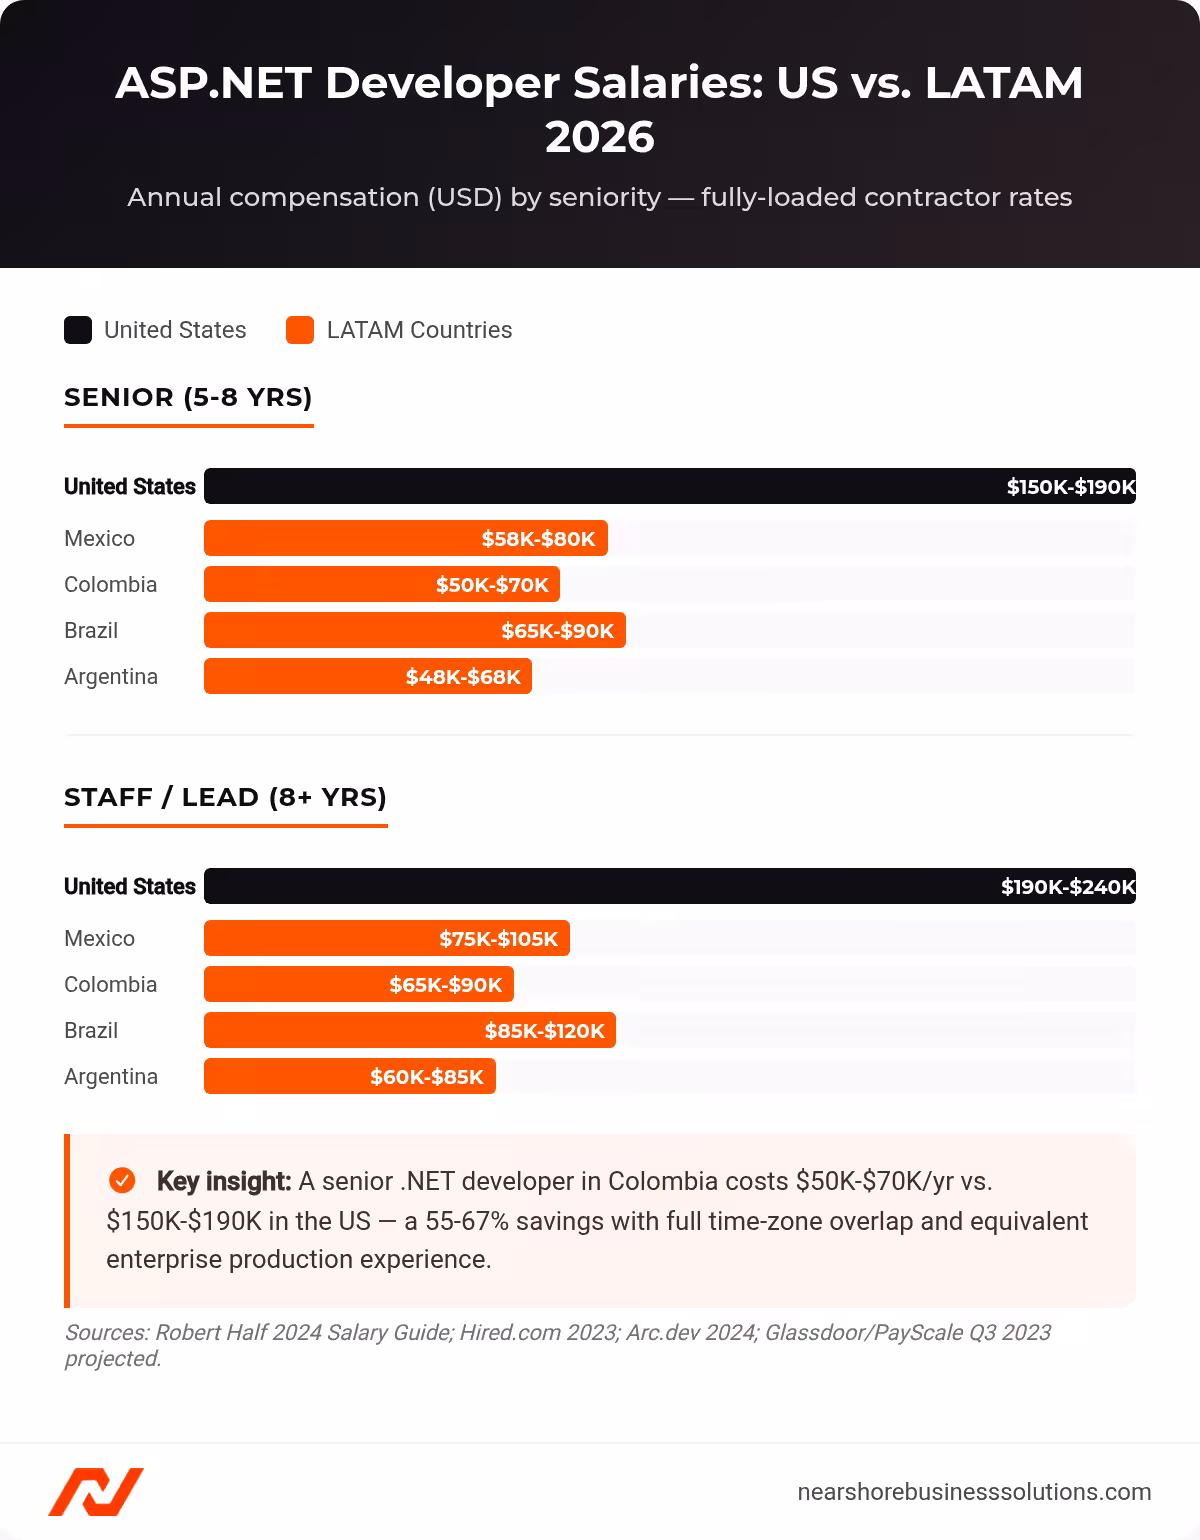
ASP.NET developer salary comparison: US vs. four LATAM markets by seniority (2026 benchmarks).
The U.S.-to-LATAM delta widens at higher seniority: a mid-level hire in Colombia saves 67 to 73%, while a Staff/Lead hire saves 55 to 66%. Senior and Staff-level LATAM developers remain the efficiency sweet spot. Mexico and Colombia cluster tightly at every level, giving engineering leaders geographic redundancy without meaningful cost variation.
How Engagement Models Affect Total Cost
Every LATAM country mandates employer contributions to social security, housing funds, severance reserves, and annual bonuses. The gap between base salary and actual annual outlay ranges from 26.5% (Costa Rica) to 68% (Brazil) (Deel Country Hiring Guides 2024; Papaya Global Countrypedia 2023).
| Country | Base Salary (Sr.) | Employer Burden | Total Annual Cost | Savings vs. US |
|---|---|---|---|---|
| United States | $145,000 | 18 to 22% | $186,000 | — |
| Mexico | $65,000 | 30 to 35% | $90,125 | 51.5% |
| Brazil | $62,000 | 60 to 68% | $106,680 | 42.6% |
| Colombia | $58,000 | 45 to 52% | $89,340 | 51.9% |
| Argentina | $55,000 | 55 to 60% | $89,625 | 51.8% |
Brazil’s 60 to 68% employer burden makes it the strongest case for contractor-based models, where the developer operates as a PJ (Pessoa Juridica), eliminating exposure to FGTS, 13th salary, and vacation bonuses. Colombia and Mexico carry burdens low enough that EOR employment remains cost-efficient at scale.
3-Year Total Cost of Ownership: 5 Senior .NET Developers
| U.S. Team | Mexico Team | Colombia Team | |
|---|---|---|---|
| 3-Year Total | $3,076,825 | $1,485,595 | $1,466,222 |
| Savings vs. US | — | $1,591,230 (51.7%) | $1,610,603 (52.3%) |
Turnover strengthens the case further. U.S. tech-sector voluntary turnover hit 15.7% in 2023 (Radford Global Technology Survey). LATAM developers working for U.S. clients turn over at 8 to 12% (aggregated nearshore provider data, 2023), because U.S.-client roles pay 2 to 3x local market rates. Lower turnover means fewer replacement cycles and less institutional knowledge loss.
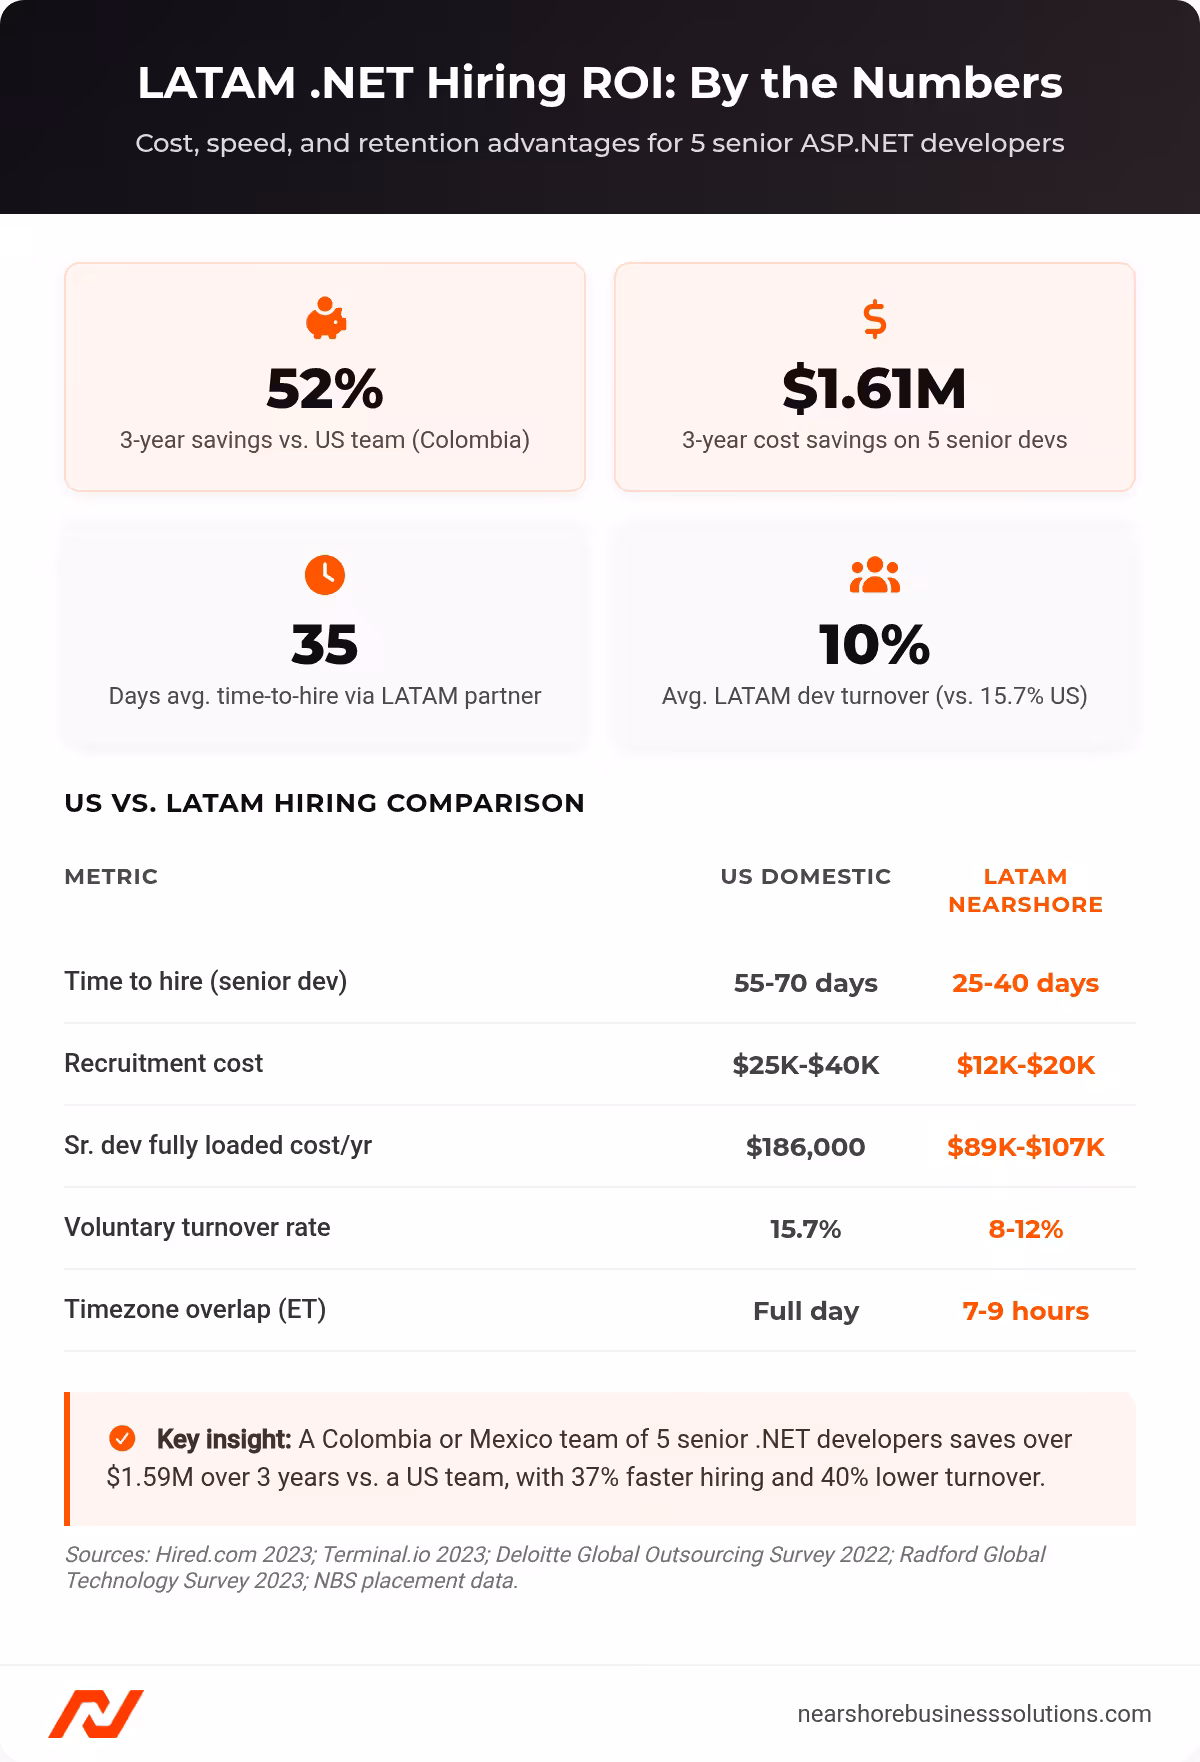
LATAM .NET hiring ROI: cost, speed, and retention advantages for a 5-developer senior team.
The Hidden Costs Most VPs Miss
Tooling: $3,800 to $7,200 per developer per year. Visual Studio Enterprise runs $2,949/year per user (Microsoft published pricing, 2024). GitHub Enterprise adds $231/year. Azure DevOps Basic + Test Plans costs $638/year. Azure dev/test compute runs $200 to $400/month. This cost is location-neutral but must be modeled.
Travel: $2,500 to $5,000 per developer per year. Two annual meetups with round-trip flights ($350 to $700) and four nights of hotel/meals ($800 to $1,500) convert a vendor relationship into an integrated engineering team.
Onboarding ramp: a 1 to 2 week delta, not a quarter-long drag. Nearshore LATAM developers reach 90% productivity within 4 to 6 weeks, compared to 3 to 5 weeks for domestic hires (Everest Group, “Nearshore as a Mainstay,” 2023). The gap reflects acculturation, not technical ramp. Model hidden costs as a 6 to 10% add-on to base compensation. Your fully-modeled cost per head still lands 58 to 60% below the U.S. equivalent.
How Skilled Are C-Sharp Developers in LATAM Compared to U.S.-Based .NET Engineers?
HackerRank’s 2023 Developer Skills Report ranks Argentina in the global top 25 for algorithmic problem-solving. Brazil and Chile land in the top 40. These rankings measure the competencies that separate syntax familiarity from system design capability: recursion, concurrency primitives, and data structure selection under constraint.
Cultural alignment amplifies technical capability. Hofstede’s framework rates LATAM as “High” for alignment with U.S. work culture: proactive communication, willingness to challenge technical decisions, and direct feedback norms that map to code review culture. India rates “Moderate,” with higher hierarchical orientation that can delay surfacing of technical debt. The Philippines rates “Moderate,” with high power distance that produces compliant teams, not collaborative ones. LATAM .NET developers argue about whether to use MediatR or a custom mediator in your architecture review. They flag when a Blazor component over-fetches data. They behave like embedded team members, not external vendors.
ASP.NET Core, Azure Cloud, and Microservices Proficiency
Senior LATAM .NET developers learn cloud-native architecture by building payment systems that process millions of daily transactions. Brazil’s fintech sector processed R$3.1 trillion ($620 billion) in digital payments in 2023 (Brazilian Central Bank). Colombian banks process cross-border remittance flows demanding sub-second latency and SOC 2-compliant logging, implemented in ASP.NET Core services behind Azure API Management gateways. Mexican e-commerce platforms serving 60+ million online shoppers (AMVO, 2023) rely on .NET microservices orchestrated through Azure Kubernetes Service.
Job market data confirms specialization depth: Azure Cloud Expertise commands a 15 to 28% salary premium across LATAM; Microservices Architecture commands 12 to 22%; ASP.NET Core commands 5 to 12% over legacy .NET Framework roles (analysis of 2023 to 2024 job postings across LinkedIn, Get on Board, and Bumeran; corroborated by Encora and Gorilla Logic nearshore provider reports). These premiums exist because demand exceeds senior-level supply, a market signal that LATAM’s .NET developers build real systems.
English Fluency and Communication Readiness
National English proficiency rankings mislead. The EF English Proficiency Index measures general populations. The relevant population is tech professionals seeking U.S.-client roles.
| Country | EF EPI Rank (2023) | General Tier | Tech-Sector Adjusted |
|---|---|---|---|
| Argentina | #28 | High | Very High |
| Costa Rica | #37 | Moderate | High |
| Brazil | #58 | Low | Moderate to High |
| Mexico | #89 | Very Low | Moderate to High |
Mexico’s #89 ranking masks the reality that Guadalajara’s technology corridor, home to Oracle, Intel, and HP, has operated in English for over a decade. Deel’s 2023 global hiring report provides the corrective: 72% of LATAM tech workers hired by U.S. companies demonstrate B2+ English proficiency. Brazil requires more deliberate screening; Mexico’s English-proficient talent concentrates in Guadalajara, Monterrey, and Mexico City.
What a Rigorous Vetting Process Should Include
Most .NET hiring failures trace to the same root cause: testing syntax knowledge without evaluating architecture judgment or communication clarity.
- Resume screening for .NET-specific production experience. Filter for developers who have shipped C#/.NET systems, not developers listing C# as one of twelve languages. Look for named products, scale indicators, and .NET ecosystem specifics.
- Coding challenge: algorithmic + system design. Combine a timed algorithm problem with a take-home system design exercise (e.g., design a rate-limited API gateway in ASP.NET Core with Redis caching and Polly retry policies).
- Live technical interview: architecture decisions. Ask the candidate to walk through a system they built. Probe trade-offs: Why Azure Service Bus over RabbitMQ? How did you handle schema migrations across 15 microservices without downtime?
- Communication assessment. A 30-minute session where the candidate explains a complex technical decision to a mixed audience. Evaluate clarity, audience adaptation, and willingness to defend positions under questioning.
- Reference check and production verification. Contact former engineering managers to verify claimed contributions. Did this developer own architecture or implement specifications written by someone else?
NBS applies this five-stage framework across every .NET developer placement. Learn more about our technical vetting process for nearshore developers.
Ready to Build Your LATAM .NET Engineering Team?
Nearshore Business Solutions sources and vets ASP.NET and C# developers from Brazil, Mexico, Colombia, and Argentina. We screen for production-grade .NET experience, English fluency, and U.S. work-style fit. Every placement includes a 90-day replacement guarantee.
Get a free consultation to discuss your ASP.NET hiring needs and receive a custom shortlist within 72 hours.