
Innovation in software development is the systematic conversion of R&D spend into shipped, revenue-generating capability. Top-quartile companies ship 2.4x faster than median peers (McKinsey), and elite engineering orgs deploy 973x more often (DORA). The teams winning through 2026 architect for innovation yield per R&D dollar, not headcount.
This guide breaks down how high-performing orgs measure innovation, why most initiatives stall, the practices that accelerate time-to-value, and the team models that scale output. The global software development services market reached $675.6 billion in 2023 and is projected to grow at an 11.7% CAGR to $1.26 trillion by 2030 (Grand View Research). With over 400,000 unfilled US tech roles and senior engineer fully loaded costs of $300,000 to $450,000, the structural decisions below determine which orgs convert that market growth into product velocity.
How Is Software Development Innovation Measured in High-Performing Engineering Orgs?
Innovation in engineering organizations is not invention. It is the systematic conversion of R&D investment into shipped, revenue-generating capabilities. US companies in the Software and Services sector increased R&D spending by an average of 14.2% year-over-year in 2023 (S&P Global Market Intelligence). For a mid-market company with $50M ARR, that translates to $7.5M to $12.5M annually. The critical question is not how much an org spends, but how efficiently that spend converts into production-grade output.
Four metrics, the DORA framework from Google’s Accelerate State of DevOps research, give engineering leaders an empirical scorecard. The 2024 report found that elite performers deploy 973x more frequently than low performers. That gap reflects fundamental architectural, cultural, and team-model decisions, not tooling differences.
Separating Innovation Theater from Measurable Engineering Output
Hackathons that produce demos but never ship to production, “innovation labs” walled off from product roadmaps, and quarterly “10% time” policies with no OKR alignment are the most common anti-patterns engineering leaders mistake for innovation culture. They consume R&D budget and produce zero customer-facing value.
Mercado Libre, the largest e-commerce and fintech platform in Latin America, builds its entire technology stack with engineers in Argentina, Brazil, and Uruguay. Product teams own architectural decisions end-to-end, shipping features at scale across payments, logistics, and marketplace products serving over 200 million users. That model demonstrates at-scale product innovation driven by autonomous engineering teams embedded in the roadmap, not by theater.
The Four DORA Metrics as an Innovation Scorecard
The four DORA metrics translate abstract “innovation capacity” into measurable signals, and elite performers separate from the pack on every one. Deployment frequency moves from once a month to on-demand, and lead time for changes drops from months to under an hour.
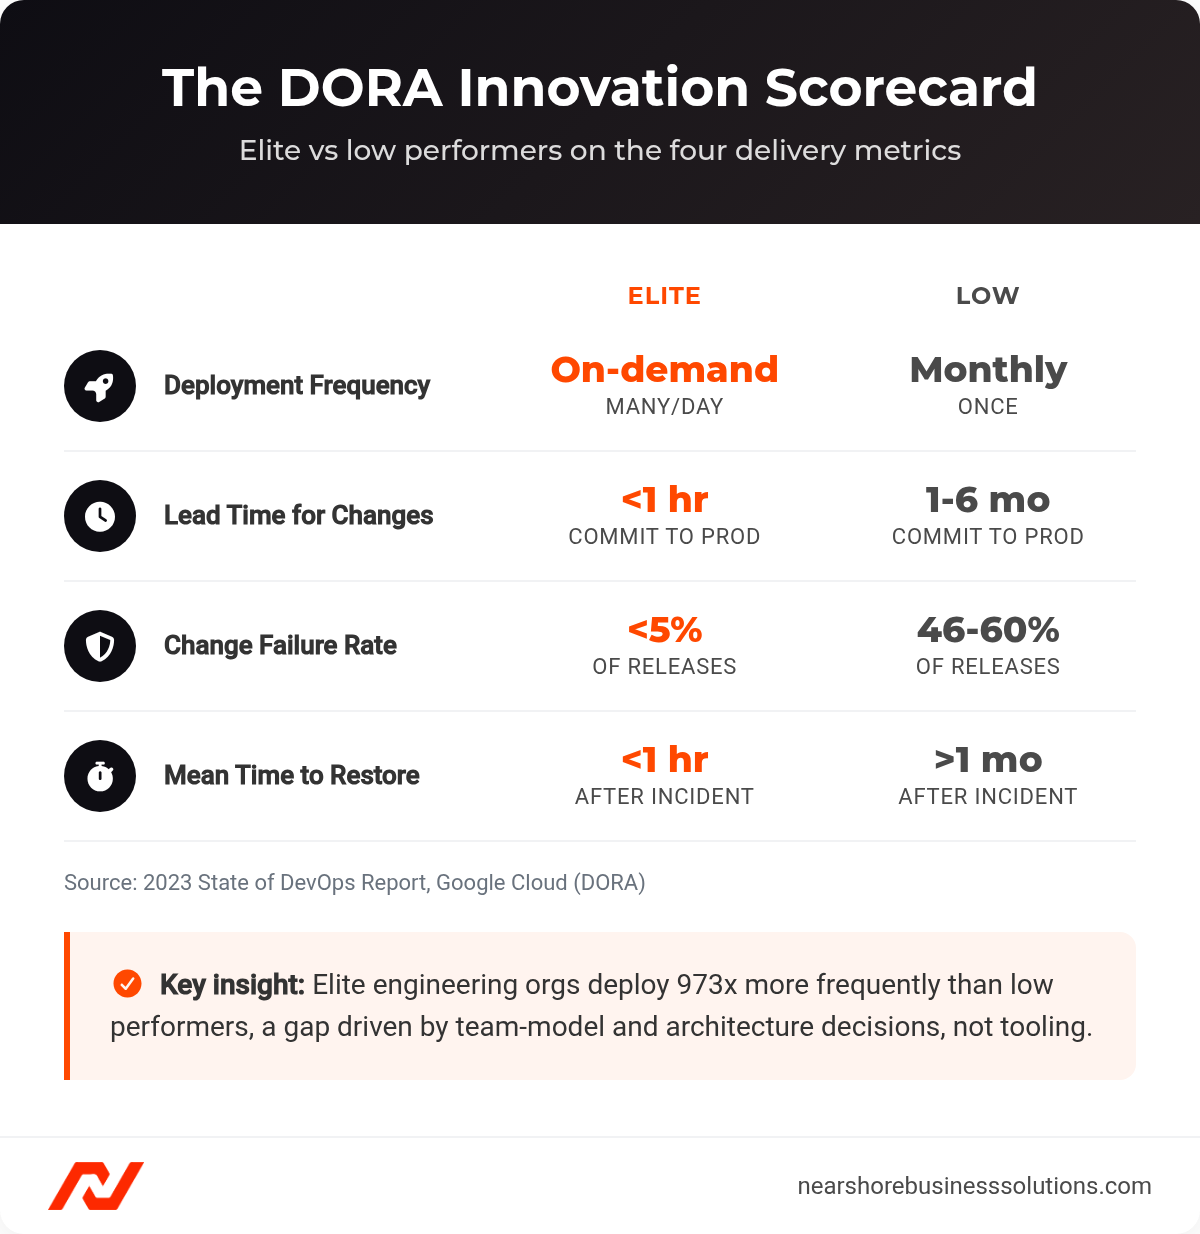
DORA delivery metrics compared across elite and low-performing engineering organizations.
| DORA Metric | What It Signals About Innovation Capacity | Elite Benchmark | Low Benchmark |
|---|---|---|---|
| Deployment Frequency | Speed at which new capabilities reach users | On-demand (multiple per day) | Once per month |
| Lead Time for Changes | Time from code commit to production | Less than one hour | 1 to 6 months |
| Change Failure Rate | Quality of the delivery pipeline | <5% | 46 to 60% |
| Mean Time to Restore (MTTR) | Organizational resilience | Less than one hour | More than one month |
Source: 2023 State of DevOps Report, Google Cloud
74% of mid-sized organizations have adopted DevOps practices to a significant degree, yet most cluster at the mid-level. The gap between “adopted DevOps” and “elite performance” is where structural and team-model decisions determine outcomes.
R&D Spend Ratio vs. Feature Throughput: The Efficiency Metric Engineering Leaders Miss
Engineering teams spend approximately 33% of their time managing technical debt rather than building new features. Applied to a $50M ARR company’s R&D budget, the compounding loss is significant:
| R&D Budget Scenario | Annual R&D Spend | Innovation Capacity Lost to Tech Debt |
|---|---|---|
| Low end (15% of ARR) | $7.5M | $2.5M annually |
| Mid range (20% of ARR) | $10.0M | $3.3M annually |
| High end (25% of ARR) | $12.5M | $4.2M annually |
The lever is not spending more on R&D. It is restructuring teams, delivery pipelines, and staffing models to maximize the innovation yield of every dollar already allocated. Many leaders close the throughput gap by hiring software developers in Latin America to add capacity without adding US-rate overhead.
Why Do Most Innovation Initiatives in Software Development Stall After Six Months?
84% of executives rank innovation as critical to their growth strategy, yet only 6% express satisfaction with their organization’s innovation performance (McKinsey Global Innovation Survey). That 78-point gap is not a creativity problem. It is a structural failure. Three structural killers account for most failures: org-chart friction, pilot purgatory, and compounding technical debt.
Org-Chart Friction: How Siloed Teams Kill Innovative Development Practices
Functional silos embed handoff delays into every release cycle. Each handoff introduces a queue, and a feature requiring four handoffs across three teams accumulates wait time that can exceed active development time by 3 to 5x. Cross-functional teams organized around product outcomes eliminate most of that coordination cost.
A study in the Journal of Software: Evolution and Process sharpens the point: development teams operating across significant time zone differences experienced slower bug resolution times and reduced code integration frequency. This carries direct implications for team-model decisions. Nearshore teams within one to three hours of US time zones preserve real-time collaboration, while offshore teams separated by eight or more hours replicate the same handoff delays that functional silos create internally.
The “Pilot Purgatory” Trap That Blocks Scaling
Most engineering organizations can run a successful pilot. Few can scale one. Cars.com embedded a nearshore team in Argentina to lead an agile transformation, moving from a single monthly monolithic release to multiple daily deployments and reporting a 35% increase in team velocity within six months (Vates). The critical differentiator: they embedded the nearshore engagement as the mechanism for platform-wide change, not a contained pilot.
Three steps separate scaling organizations from those trapped in perpetual pilots:
- Validate with constraints. Run the pilot with a 60 to 90 day timebox and no more than two measurable outcomes. Success signal: target metrics improve by at least 20% without degrading change failure rate.
- Codify the playbook. Dedicate 30 to 45 days post-pilot to documenting workflow changes. Success signal: a second team reproduces at least 80% of the pilot’s improvement within 30 days.
- Diffuse through platform, not mandate. Encode the practice into shared infrastructure. Success signal: at least 50% of teams operate on the new practice within two quarters.
Technical Debt as a Hidden Innovation Tax on Every Sprint
The average annual turnover rate for US software developers sits at 15 to 20% (LinkedIn Talent Solutions). Each departure costs $150,000 to $200,000 and destroys institutional knowledge. The compounding loop: technical debt slows delivery, slower delivery frustrates senior engineers, frustrated engineers leave, departures destroy knowledge, new engineers add more debt, and debt grows faster. Organizations that do not break this loop will find their effective innovation budget shrinks every quarter even as nominal R&D spend increases.
Which Development Practices Actually Accelerate Time-to-Value in Production?
Four practices move time-to-value the most: AI-assisted development, continuous delivery, MVP-driven shipping, and platform engineering. Teams that combine them report 30 to 55% faster delivery on the tasks each one targets. The sections below show what the data supports and where human judgment still governs.
AI-Assisted Development: What the Data Actually Shows
Over 1.3 million developers now pay for GitHub Copilot, and 77% of developers surveyed by Stack Overflow reported using or planning to use AI tools. GitHub’s controlled study measured 55% faster task completion. Accenture documented 30 to 50% productivity gains in code generation and a 20% reduction in bug-fixing time. These gains concentrate in boilerplate-heavy tasks. For complex architectural work and security-sensitive code paths, AI output requires rigorous human review: mandatory security review on AI-generated code, hallucination detection in test generation, and documentation provenance tagging.
Continuous Delivery and DevOps Ownership
Netflix ships thousands of production changes per day. These organizations treat the path from commit to production as a single integrated system built on trunk-based development, feature flags, and canary deployments with automated rollback triggers. The cultural layer, “you build it, you run it,” creates a direct feedback loop: engineers who debug their own incidents write more resilient code.
This ownership model depends on time zone overlap. When a critical incident fires at 2 PM Pacific, a nearshore team in Mexico City or Bogotá is fully online. An offshore team in Bangalore is asleep. An estimated 10 to 15% productivity loss occurs in offshore models due to communication lags, while in nearshore models this loss is negligible at under 2%, directly impacting CD pipeline velocity and MTTR. Staffing this layer with dedicated DevOps engineers in Latin America keeps the pipeline owned during US business hours.
MVP-Driven Development: Shipping to Learn
68% of product teams use an MVP approach, reporting 30 to 40% reductions in time-to-market (ProductPlan). The structured cycle: frame a hypothesis with quantitative success criteria, build the minimum viable proof, instrument with analytics behind a feature flag, measure against pre-defined thresholds, then either kill, pivot, or graduate to roadmap. The kill decision is the most valuable output. It prevents six months of full-team investment in a direction the market rejected in six weeks.
Amount, a FinTech SaaS platform, scaled from a small team to over 50 dedicated LATAM-based engineers in under 12 months, accelerating its product roadmap by an estimated 40% (published nearshore case study). The speed of team assembly meant Amount did not lose a quarter to recruiting before executing.
Platform Engineering: Reducing Cognitive Load
Gartner projects that 80% of software engineering organizations will establish dedicated platform teams by 2026. Internal developer platforms absorb toolchain complexity into a shared layer: golden paths for common tasks that let a new engineer ship to production on day one. GitLab’s 2023 Global DevSecOps Report found that 65% of developers in Latin America reported their teams use DevOps practices, comparable to North American adoption at 69%.
How Do Cross-Functional Squads and Embedded R&D Drive Experimentation?
Cross-functional squads that own a full vertical slice eliminate the handoff queues that component teams create, and reserving 15 to 20% of sprint points for experimentation institutionalizes R&D without a walled-off lab. Eventbrite grew one such hub from zero to over 100 engineers in two years. The two levers below explain why ownership beats co-location.
Cross-Functional Squads vs. Component Teams
Component teams force every feature through multiple handoffs, each introducing queue time and defect injection. Stream-aligned teams that own a full vertical slice eliminate that coordination cost.
Eventbrite established a core engineering hub in Mendoza, Argentina, where the team took full ownership of its “Organizer” mobile app, driving the entire product roadmap autonomously. The hub grew from zero to over 100 engineers in two years with significantly higher retention rates than San Francisco headquarters. For engineering leaders designing agile staff augmentation models, cross-functional ownership, not geographic co-location, is the variable that drives sustained throughput.
Embedding R&D Experimentation into Sprint Cadences
Google’s “20% time” produced Gmail and AdSense, but the unstructured version fails in delivery-focused organizations. The adapted model: reserve 15 to 20% of sprint points for experimentation, frame every experiment as a hypothesis with kill criteria, time-box to two sprints maximum, and report outcomes in a standardized format that builds an institutional library of validated and invalidated assumptions.
Which Team Model Scales Innovation: In-House, Nearshore, or Hybrid?
76% of tech leaders now prioritize access to talent over cost savings when evaluating distributed team models (Deloitte). CompTIA projects 423,618 unfilled tech roles in the US, with software developer employment projected to grow 25% from 2022 to 2032, five times the average occupation growth rate.
Latin America’s developer population exceeds 1.2 million and grows at approximately 12% year-over-year, three times the North American rate. Argentina consistently ranks in the global top 20 for algorithm proficiency on HackerRank, and Brazil’s open-source community ranks 6th globally on GitHub. Teams that hire backend developers and full-stack engineers from this pool tap senior talent at a fraction of US fully loaded cost.
Nearshore Teams as an R&D Extension
The nearshore model’s structural advantage is collaboration fidelity through time-zone overlap:
| LATAM Hub | Time Zone | Overlap with ET | Overlap with PT |
|---|---|---|---|
| Mexico City | CST | 8 hours (Full Day) | 6 hours |
| Bogotá | COT | 8 hours (Full Day) | 5 hours |
| Buenos Aires | ART | 6 hours | 3 hours |
| São Paulo | BRT | 6 hours | 3 hours |
The economic case is equally clear. Nearshore models maintain a predictable TCO, often within 5 to 10% of initial estimates, because hidden costs are minimized (Gartner, 2023). Reputable nearshore partners report retention rates of 90 to 97% annually. Combined with fully loaded senior engineer costs of $82,500 to $105,000 versus the US average of $310,000, the result is not just lower cost but higher effective output per dollar, enabling reinvestment into the innovation practices outlined above. Companies that prefer a compliant payroll path can run the same talent through an employer of record in Latin America without opening a local entity.
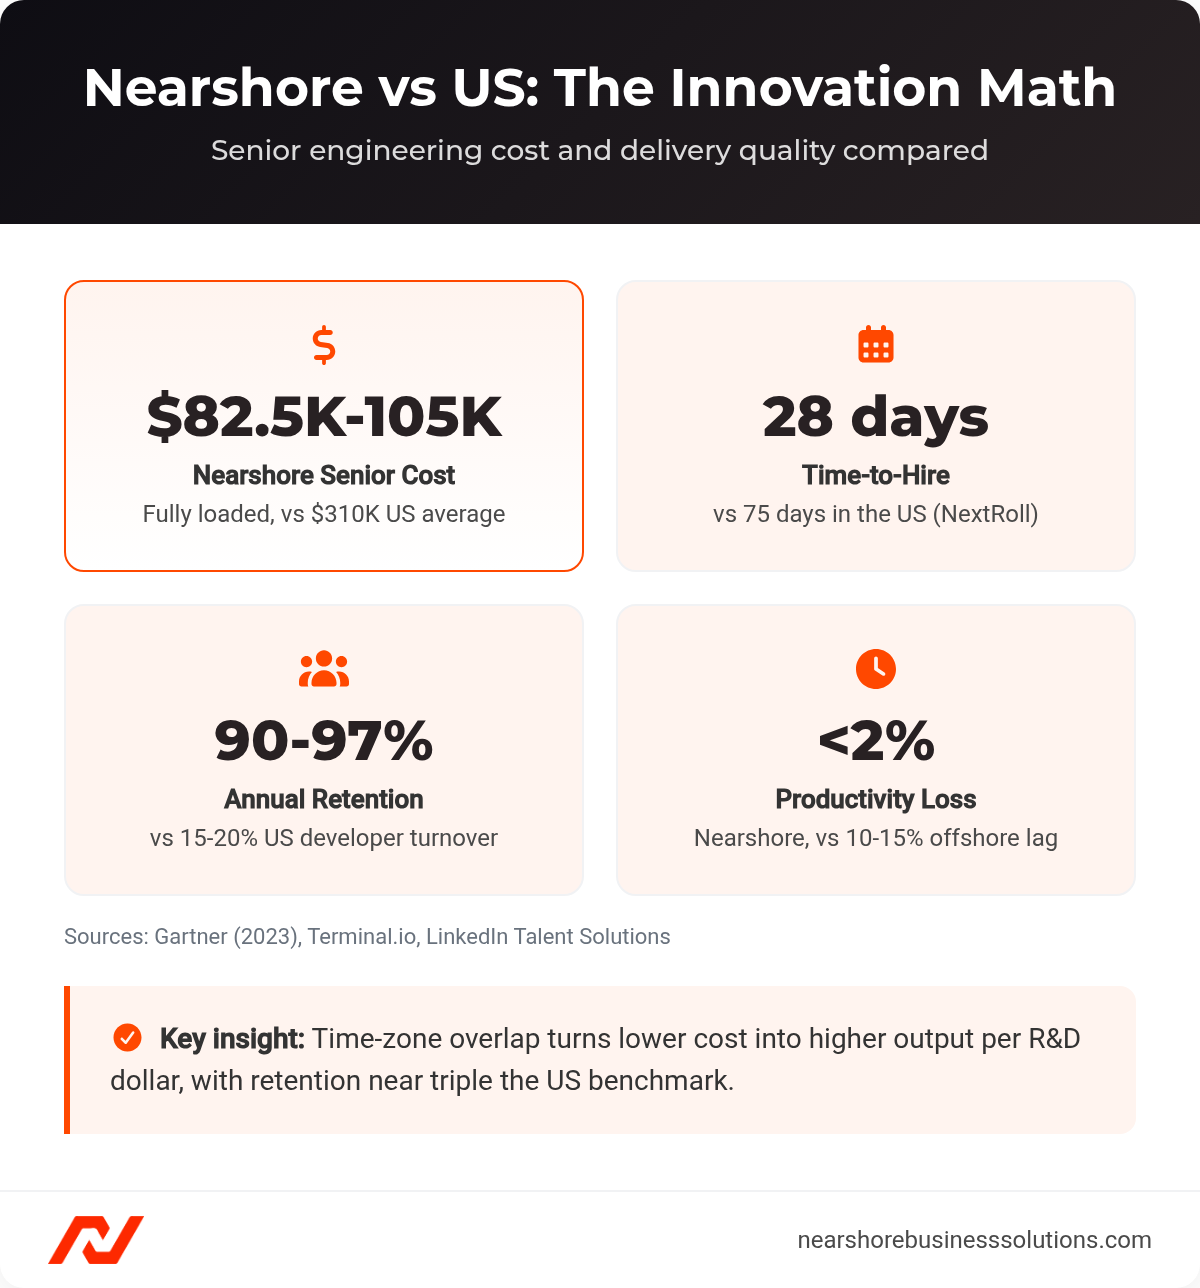
Nearshore versus US senior engineering cost, time-to-hire, retention, and productivity.
Structuring Hybrid Teams for Continuous Delivery at Scale
| Role | Recommended Location | Key Responsibilities |
|---|---|---|
| Engineering Manager / Tech Lead | In-house (US) or senior nearshore | Architecture decisions, sprint planning, stakeholder alignment |
| Senior Engineers (2 to 3) | Split: 1 US + 1 to 2 nearshore | Feature development, code review, mentorship |
| Mid-Level Engineers (2 to 3) | Nearshore | Feature development, test coverage, documentation |
| DevOps / Platform Engineer | Nearshore or in-house | CI/CD pipeline, IDP maintenance, observability |
| QA / SDET | Nearshore | Test automation, regression, exploratory testing |
NextRoll validated this model by building a high-performing engineering team in Guadalajara, Mexico, reducing average time-to-hire from 75 days in the US to 28 days, achieving 50%+ cost savings on a fully loaded basis, and experiencing a 95% engineer retention rate over two years (per a published nearshore platform case study). For SaaS startups facing similar talent constraints, the hybrid model converts a hiring bottleneck into a scaling advantage.
Innovation in software development is not a moment. It is a system. The organizations that will lead through 2026 are those building that system now: measuring with DORA, shipping with continuous delivery, experimenting within sprint cadences, and staffing through team models that match talent supply to innovation demand.
Frequently Asked Questions
How much faster do nearshore teams respond to production incidents than offshore teams?
The difference is structural, not a matter of effort. When a critical incident fires at 2 PM Pacific, a nearshore team in Mexico City or Bogotá is fully online, while an offshore team in Bangalore is asleep. That time-zone gap is why offshore models lose an estimated 10 to 15% of productivity to communication lags and asynchronous handoffs, whereas in nearshore models the loss is negligible at under 2%, directly improving mean time to restore (DORA-aligned MTTR) and continuous delivery velocity.
Can AI coding tools like GitHub Copilot be trusted for security-sensitive or complex architectural work?
Not without rigorous human review. The documented productivity gains, including GitHub’s measured 55% faster task completion and Accenture’s 30 to 50% gains in code generation, concentrate in boilerplate-heavy tasks. For complex architectural decisions and security-sensitive code paths, AI output requires mandatory security review on generated code, hallucination detection in test generation, and documentation provenance tagging before it reaches production.
How quickly can a nearshore engineering team be assembled and reach full productivity?
Faster than most US in-house hiring cycles. A specialized nearshore partner typically presents your first pre-vetted candidates within 3 business days, versus an average US time-to-hire of 45 to 60 days. At scale, the ramp is just as fast. Amount, a FinTech SaaS platform, scaled from a small team to over 50 dedicated LATAM-based engineers in under 12 months (published nearshore case study), and Eventbrite grew its Mendoza, Argentina hub from zero to over 100 engineers in two years.
What does engineer turnover actually cost, and how does nearshore retention compare?
In the US, average annual developer turnover runs 15 to 20% (LinkedIn Talent Solutions), and each departure costs $150,000 to $200,000 in recruiting, lost productivity, and destroyed institutional knowledge. Reputable nearshore partners report retention rates of 90 to 97% annually, and named engagements like NextRoll’s Guadalajara team have held 95% retention over two years (per a published nearshore platform case study). Lower churn protects the institutional knowledge that compounds into innovation capacity.
How much R&D budget is lost to technical debt, and how do teams recover it?
Engineering teams spend approximately 33% of their time managing technical debt rather than building new features. Applied to a $50M ARR company spending 20% of ARR on R&D, that is roughly $3.3M of innovation capacity lost annually. The recovery lever is not spending more, it is restructuring teams, delivery pipelines, and staffing models so a larger share of every R&D dollar converts into shipped, revenue-generating output.
Ready to Build a Nearshore Engineering Team That Ships Faster?
Nearshore Business Solutions sources and vets senior software engineers across Mexico, Colombia, Argentina, and Brazil, screening for technical depth, English fluency, and US time-zone overlap. You receive your first pre-vetted candidates within 3 business days, with fully loaded senior costs of $82,500 to $105,000 versus the US average of $310,000.
Book a free scoping call to design your hybrid delivery team and receive a custom staffing plan.